Editor’s Note: This text course is an edited transcript of a live seminar. Download supplemental course materials.
Thank you for joining us for this course featuring head impulse testing from Otometrics. Today we will be talking about the professional progression from visual observation to video recording. My name is Wendy Crumley-Welsh, and I am the product manager for the balance line at Otometrics, which includes the ICS Impulse.
The first thing we are going to talk about is the history of head impulse testing and development, which took us from visual observation to where we are today. In 1988, a seminal article was published by Dr. Ian Curthoys and Dr. Michael Halmagyi. They are the two researchers who discovered that head impulse testing was a viable tool in assessing site-of-lesion disorders and the vestibulo-ocular reflex. In the publication, they showed a technique using visual observation for head impulse testing. Before clinicians were doing head impulse testing, they would have the patient face them and ask them to stare at their nose. The clinician would do a quick turn of the patient’s head, or a head impulse, to the left or the right. If you turn to the left, you are stimulating the left lateral canal, and if you turn to the right, you are stimulating the right lateral canal. If the person has a normal vestibulo-ocular reflex, they should be able to maintain fixation on the tester’s nose during these head impulse tests. Halmagyi and Curthoys (1988) found that patients who had an abnormal vestibulo-ocular reflex could not maintain this fixation. Therefore, the eyes would turn with the head and then come back to the nose. This is called a catch-up saccade or re-fixation saccade.
Goggles vs. Visual Observation
Visual observation was a useful tool to test the vestibulo-ocular reflex, with both advantages and disadvantages. When you compare video head impulse testing (vHIT) using goggles versus visual observation, the vHIT can identify both covert and overt saccades. An overt catch-up saccade happens after the head movement stops, and a covert catch-up saccade happens during the head movement. We are going to look at some data to show you the differences. We have discovered that vHIT can identify both of these types of catch-up saccades. Unfortunately, visual observation was only able to identify the overt catch-up saccades. When using our eyes, we can only see the catch-up when it happens after the head movement stops. Sensitivity is estimated at 70% for visual observation (Weber, et al., 2008). The reason that sensitivity is lower is because we can not see the covert catch-up saccades.
With the vHIT, we also get a reduction in false negatives. False negatives occur because we cannot see the covert catch-up saccades with our naked eye. It was also discovered that vHIT cameras are more sensitive than the naked eye, as you do not have to do large head impulses. I have seen many neurologists perform head impulse testing using visual observation on a daily basis. Typically they move the head more than 20 degrees, even up to 300 to 400 degrees per second. These are pretty significant head impulses. The nice thing about vHIT is that you do not have to make that big of a head movement; the sweet spot is between 150 and 250 degrees per second. The benefit of the vHIT is that it is more comfortable for the patient.
You can also validate that the head impulse is performed properly with the vHIT. There are tools in the test systems, especially in the ICS Impulse, that show you that you are not performing a movement that is too slow or has too much overshoot. We will talk about overshoot in a minute.
The next advantage of using the vHIT over visual observation is that you have an objective analysis with normative data. You do not have to say, “I think I saw catch-up saccades,” and then document it by writing it down. With vHIT, you have an objective analysis, and then you can document something in the patient file that shows the test was done properly, including the results and your diagnosis from those results.
Those are the advantages of the vHIT over visual observation. We can see both overt and covert saccades. It is more sensitive. We have a reduction of false negatives, patient comfort is much better, we can validate that the head impulse was performed properly. You get a nice objective analysis and you have documentation for the head impulse.
Scleral Search Coils vs. Visual Observation
Visual observation was discovered in 1988. But before there was vHIT with goggles, researchers were looking at doing head impulse testing with scleral search coils. This is where covert catch-up saccades were discovered. A scleral search coil almost looks like a contact lens on the eye (Figure 1). It measures the eye movement. In Figure 2, you can see a bite bar in Dr. MacDougall’s mouth; that is the gyroscope that measures the head movement. Scleral search coils are also performed in a large magnetic box, which you see in Figure 2. It is a very large, expensive system. They have to anesthetize the eye to put on this coil. This system is not something that you are going to have in every clinic. It is found mostly in larger facilities that are doing research on eye movement and head movement.
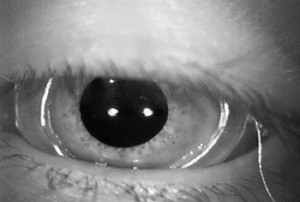
Figure 1. Scleral search coil.
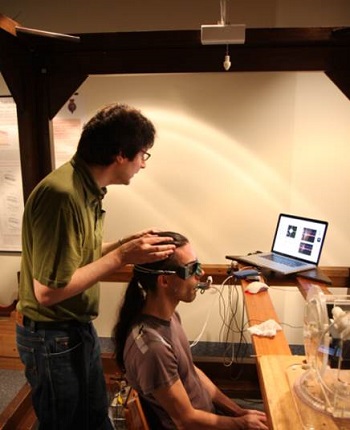
Figure 2. Scleral search coil test unit, with bite bar in patient’s mouth.
We wanted to move beyond search coils and develop something that would give us equivalent sensitivity and be easier to use in the clinic. That is why we moved from coils to vHIT. During all the coil investigation, researchers discovered covert catch-up saccades (Halmagyi, Weber, Aw, Todd, & Curthoys, 2008). Remember when you are doing visual observation, you can only see the catch-up saccade if it happens after the head movement stops. But by using the scleral search coils, they discovered that people had catch-up saccades during the head movement, which is what we now call covert catch-up saccades.
Figure 3 shows data from the ICS Impulse. The orange is the head movement. The green is the eye movement. I have one tracing highlighted. The head movement is blue, and the eye movement is dark green. The big red spike that you see is the catch-up saccade. This is an example of covert catch-up saccade that is happening before the head movement stops. Those are the kind that you cannot see with the naked eye. Sometimes you see a big covert catch-up saccade, and then you have a smaller overt saccade afterwards, which you can see in Figure 3. The second red spike is an overt catch-up saccade, because it is happening after the head movement has stopped. Again, we identified covert catch-up saccades by the research that was done with the scleral search coils.
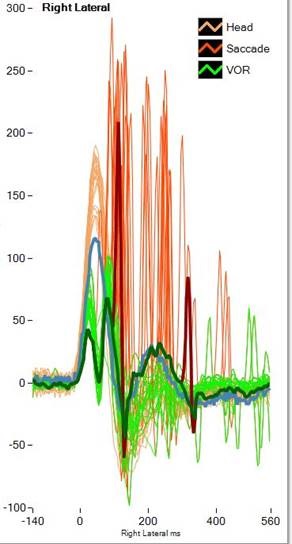
Figure 3. ICS Impulse vHIT recording data. Orange= head movement; red= covert or overt saccade; green= vestibulo-ocular response. Note the covert catch-up saccade occurring first in the response, followed by an overt saccade later in the tracing, after the head movement has stopped.
We wanted to see if we could develop a system as good as the coil, but that could be used in any clinic with any patient. A group in Australia, Hamish MacDougall, Konrad Weber, Leigh McGarvie, Leonardo Manzari, Michael Halmagyi, and Ian Curthoys, developed something better than the search coil. They started with a goggle that would work for head impulse testing in 2004. It had cameras on two sides and gyroscopes off to the side. They needed a goggle that does not slip, because any slippage of the goggle is going to look like eye movement, and it will be inaccurate data. You want to make sure that the goggle does not move on the patient’s head during a head impulse testing. That was a challenge.
Many times, they tried to go to two cameras, but the weight and mass was too much. Therefore, they needed a one-camera system. As technology develops in the next 10 to 20 years, is there a possibility to have a two-camera system? Absolutely; but right now the components are just not small enough. The importance is to have something that records the eye movement on a goggle that does not move. In 2008, the development of the goggle was reduced to a one-camera system. These head impulse systems are very different from our traditional videonystagmography (VNG) goggles. Traditional VNG goggles have a large mass and a large housing. The goggles come over the mirrors. With the vHIT system, the mirrors stick out, because the goggle needs to be light and close to the face. The issue with the mirror is that you do not want to reflect light. If the mirrors are on the underside of the goggle, you run the risk of reflecting the light from the ceiling, so the mirror was moved off to the side. However, you want to make sure that your computer screen is not facing straight into the mirror, because any kind of reflection could distract the patient from looking at the fixation dot during the test.
I had the privilege of seeing this prototype in 2008, and then we worked with the Australian team to develop the ICS Impulse based on the prototype. The 2010 prototype was very similar to what we have today in the ICS Impulse. The beauty of these goggles is that they were tight fitting, very lightweight at less than 60 grams, and fitted with a high-speed camera to pick up these catch-up saccades. We also needed to be able to measure the head movement. That is where we use the gyroscopes and accelerometers. That is a 6-degree of freedom inertial sensor which is inside the goggle. An illustration of the various prototypes over the years is shown in Figure 4.
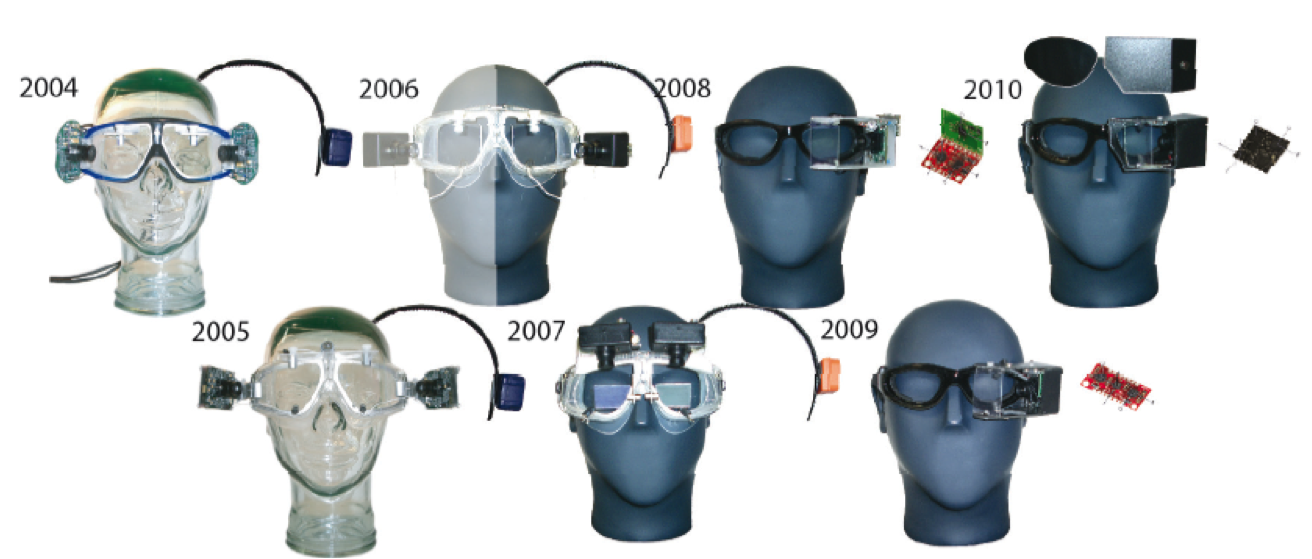
Figure 4. Goggle prototypes, 2004 - 2009.
Figure 5 is the prototype that Otometrics started with, and then we had to develop something that could be manufactured, pass Underwriters Laboratories (UL), and also be safe for the end user. What you see in this prototype is the calibration laser. There is a camera which measures the eye movement. There are the infra-red LEDs, and inside the board are the gyroscopes that measure the head movement.
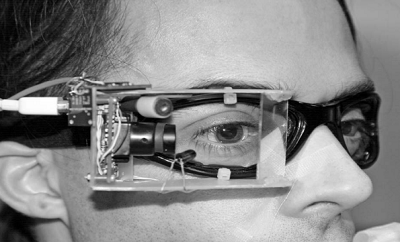
Figure 5. 2010 goggle prototype.
Figure 6 is what we ended up with. This is the ICS Impulse. You have the mirror out to the side, similar to the prototype, and the two little dots on the upper right eye of the goggle are the calibration lasers. We will talk about calibration. Inside the small box is the camera and the sensor that measures the head movement. I want to point out, again, that you have to make sure that the goggle is low weight/low mass. Low mass means that there will be no torque. You have to make sure that goggle stays on the person’s face and does not move during head impulse testing. It is a very quick, abrupt movement, and the goggle needs to stay put. A VNG goggle is more likely to move during the head impulse testing. A vHIT goggle needs to be light, low mass, and fit firmly to the face.
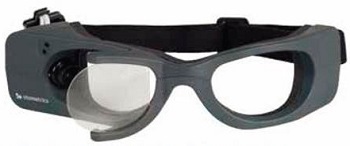
Figure 6. ICS Impulse goggle.
Otometrics already has a VNG goggle, the VG40. From a development and expense standpoint, it would have been much more cost-effective to use the VNG than spending several years developing a completely new goggle, but we could not. VNG goggles of all makes and models are much larger, have much larger masks, and weigh more. None of them will work for head impulse testing because they will physically move during the test. We were not able to use our VG40 goggle either, and so we developed a completely new goggle for head impulse testing, the ICS Impulse.
Much data was collected to answer the question, "Is this prototype goggle equivalent to the search coils?" We wanted to make sure that the data collected using the vHIT was going to be equivalent to the data obtained from the scleral search coils. The first article that came out in 2009 by MacDougall, Weber, McGarvie, Halmagyi, and Curthoys compared the prototype goggle to the search coils using lateral head impulses. They found that the vHIT was equivalent to scleral search coils. A new article published in 2013 by MacDougall, McGarvie, Halmagyi, Curthoys and Weber looked at left anterior right posterior (LARP) and right anterior left posterior (RALP). This article also says that the vHIT is equivalent to the scleral search coils when testing the vertical, anterior and posterior semicircular canals.
Back in Figure 2, Dr. Konrad Weber and Dr. Hamish MacDougall are testing the search coils against the Impulse. We knew the prototype was equivalent to the search coils, so we took that prototype and made it manufacturable by making a couple of small changes. We wanted to ensure that this new ICS goggle was still equivalent to the scleral search coils. What you see in Figure 7 is Dr. MacDougall wearing the goggles. He has the coil in his eye; you can see the wire coming down taped to his cheek, and he has the head sensor for the coils in his mouth. We did simultaneous and sequential testing looking at the ICS Impulse to the scleral search coils. We did this for all six semicircular canals. The ICS Impulse is the only device that has been validated against the scleral search coils for all six canals.
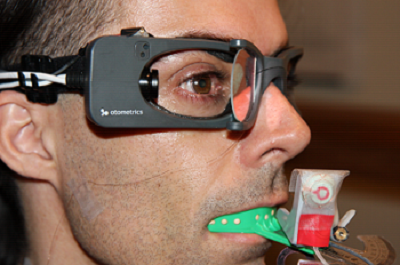
Figure 7. View of ICS Impulse goggles and scleral search coil in the eye for comparative testing.
Figure 8 shows some of the data we obtained from four different patients when testing the goggles. The first patient has lateral medullary syndrome. The second patient has inferior vestibular neuritis. The third patient has bilateral cerebral stroke, and the fourth patient has pontine stroke. The black is the prototype, the red is the ICS Impulse and the blue is the search coils. You can see that the data matches up quite well. In your handout, there is another handout called Coil versus Impulse, which gives you more data for sequential and simultaneous testing. In short, the ICS Impulse is equivalent to the scleral search coils.
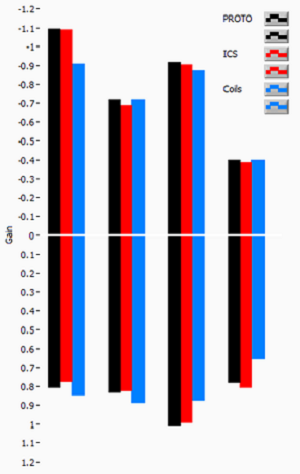
Figure 8. Data obtained from four patients comparing the variability between the ICS impulse and scleral search coils. Black= prototype; Red= ICS goggles; Blue= scleral search coils.
Another hardware component that was important was the development of the face cushion. This is the cushion that goes in between the patient’s skin and the outer plastic housing of the Impulse goggle. Our goals for the face cushion design were that it could be disposable and inexpensive. Being the product manager, I need to ensure that the cost of this face cushion to the end user is not exorbitant. We needed to make sure that we could sell it for one dollar or less if it was going to be thrown away.
We had to make sure there was no slippage and that it fit most all faces. Figure 9 shows the third rendition of the face cushion. We started off with one type of foam, and it worked fairly well with most people. Then we moved to a different, high-density foam that worked better, and now we are on to a memory foam, which seems to work quite well with most faces. Our current face cushion does work for the majority of people, and we are also working on a face cushion that would be tailored for patients who do not have as substantial a nose bridge.
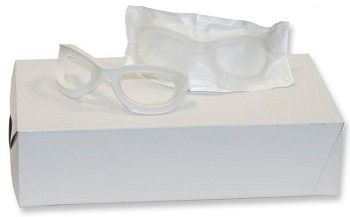
Figure 9. Face cushion for ICS Impulse goggles.
Software
We have talked about hardware and the goggles, but you need to know that there was a great deal of work from the Sydney group that went into the software as well. We have a goggle that fits the face, has low mass, does not move, but can we still collect good data? We are now going to talk about quality data collection and ease of use. We will also talk about ensuring a high frame rate so we can detect those catch-up saccades, the collection analysis algorithm to ensure that only good data is analyzed, identification of saccades, how we measure gain, and some quality indicators such as training curves, operator feedback, and training material.
The first thing that was important regarding the software was the camera. Most monocular VNG goggles are between 60 and 170 frames per second; if it is binocular, you get closer to 100 frames per second. That speed is not fast enough to detect a catch-up saccade. The camera that we have in the ICS Impulse is 250 frames per second. Remember that VNG responses are slow and gentle. We are looking at saccades, smooth pursuit, or positionals. With the head impulse, you are performing a very quick movement, and this means that eye movement is also very quick. Catch-up saccades are also very fast. This is why you need a camera that performs more frames per second than our traditional VNG goggle.
Researchers using scleral search coils recorded eye movements at 1000 Hz or even 5000 Hz. They had originally thought that video was too slow until we were able to demonstrate 250 frames per second. One of the researchers, Hamish MacDougall, believes that 250 frames per second is the sweet spot in the trade-off between frame rate or temporal resolution and image pixels or spatial resolution. If you go to icsimpulse.com and look at how the data is collected, the region of interest is a bit smaller so that we can pick-up faster frame rates. That is what is meant by temporal resolution versus spatial resolution.
Recording saccades at a low frame rate can distort their shape or completely miss them. At 120 frames per second, you often get one sample point during a saccade, so the shape looks like a single spike, and its amplitude becomes dependent on when the sample was taken. It is more difficult for desaccading algorithms to recognize; we will talk later about desaccading. That is how we measure our gain. A lot of work went into how many frames per second we should use for recording vHIT. The technology that we have now suggests that 250 Hz is the max that we can obtain.
Hamish MacDougall put together a grouping of data recordings (Figure 10). The top left panel is 250 Hz. In this example, the green is the head movement, the blue is the eye movement, and the red spikes are the saccades. At 250 Hz, we see a covert saccade early in the recording and an overt saccade slightly later in the recording. As you look below in the next panel for 125 Hz, you can still see the saccades, but Hamish points out that it really comes to chance. Did you just happen to record a point when the catch-up saccade occurred? In the bottom left panel at 62.5 Hz, you notice that the covert catch-up saccade is not there, and the overt catch-up saccade is there but broad. This demonstrates that as you reduce your frame rate, you are less likely to pick up on the catch-up saccades. If you look over to the panels on the right showing 250 versus 500 Hz, we notice that you do not gain anything by increasing the frame rate. The data looks exactly the same. We already discussed that 250 Hz was the sweet spot between temporal and spatial resolution. Having the correct frame rate is important for identifying if the eye movement is abnormal and produces a catch-up saccade.
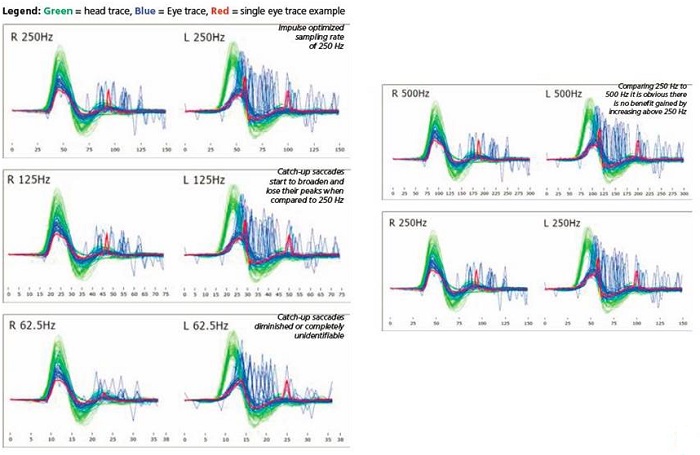
Figure 10. Examples of head impulse recordings for varying frame rates. Green=head trace; Blue=eye trace; Red= single eye trace or saccade.
In the ICS Impulse, the frame rate is always displayed (Figure 10). If the frame rate drops below 219 frames per second, then the Impulse data will automatically be rejected. It will give you a message that the frame rate is too slow for data collection. We want to make sure that the frame rate stays as high as possible. At the end of the test, you can go into every single recording and see the average frame rate for that test. Figure 11 shows an example of 245 frames per second.
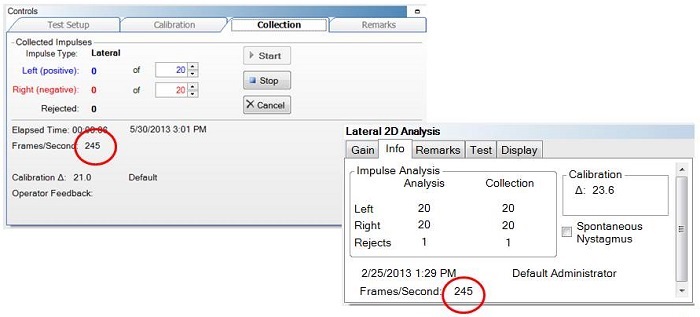
Figure 11. Screen shots from the ICS Impulse software, showing recording frame rates.
In most all cases, the computer affects the frame rate so you have to make sure that you have a decent computer. You should not have the wireless feature on or have other programs running in the background. The computer must be plugged in to an outlet using the power cord and not running off of the battery. We sell the computer with the ICS Impulse, so we ensure that you do not have frame rate issues.
Algorithms
There is a collection algorithm and an analysis algorithm to ensure that only good data is analyzed. The collection algorithm looks at all 250 samples. We look at the velocities of the eye and the head movements, and the collected data is then compared to what a good head impulse should look like according to the training curves. Your data needs to match the shape of the training curves. The training curves are based on thousands of head impulses that were collected at specific velocities. The eye velocity must be within a particular boundary, which is comparable to how the eye should move during a proper head impulse. If the eye or head is outside of these boundaries, then the impulse is rejected. If they are within the boundaries, the impulse is accepted. The patient cannot be looking around or blinking in excess. If the patient does have spontaneous nystagmus, we can adjust the algorithm to compensate for the nystagmus. This makes the collection algorithm a little more flexible so that it does not reject the tracing due to spontaneous nystagmus. That is important if you are testing acute patients that may come in to the emergency room.
The collection tab is shown in Figure 12. What you see is the number of accepted responses for the left head impulses and the right head impulses; below that is the number of rejections. The training curves are shown below the collection box in gray. The head impulse should match up to that training curve if it is a good test.
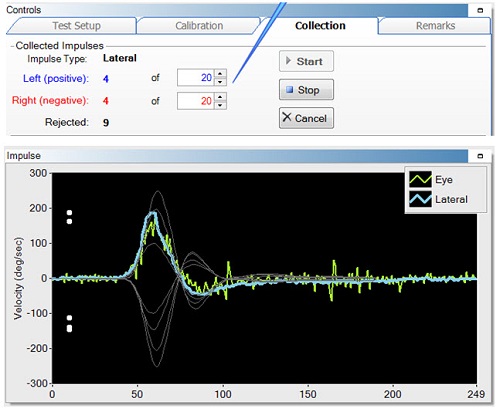
Figure 12. Collection tab, indicating the accepted responses and rejections (top), and the training curves (bottom, gray) to match the recorded responses.
The second algorithm is the analysis algorithm. All the data goes first through the collection algorithm, which determines if you performed the correct number of acceptable head impulses, including both the accepts and the rejects, not just what was accepted by the collection algorithm. All the raw data then goes through the analysis algorithm. This looks at 175 samples. We eliminate data at the beginning and at the end of the head impulse that is not very useful. Then we reanalyze the data. It is very similar to the collection algorithm, in that it looks at the head impulse tracing and eye movements and compares those to the training curves. If the head and the eye movements are outside these boundaries, they are rejected. If they are inside these boundaries, they are accepted. The main difference between the two algorithms is that during the analysis algorithm, the head data is run through the velocity peak detection algorithm to determine exactly where the peak of the head impulse resides. This is needed for us to calculate gain.
The analysis algorithm is shown in Figure 13. Whatever passes through the analysis algorithm is displayed on 2D and 3D graphs. Under the Info tab, you have exactly what was accepted and what was rejected in the collection algorithm, and then what happened in the analysis algorithm. In this example (Figure 13, top) of a lateral head impulse, the collection algorithm accepted 10, but the analysis algorithm only accepted 9. The right side was 10 and 10, and then obviously the rejects are 0 and 1 for collection and analysis, respectively. If you perform your head impulses properly, the two numbers should be almost identical. In the LARP 2D panel (Figure 13, middle), the collection data are identical, and in the RALP (Figure 13, bottom), there was one extra reject on the right anterior side. If you see a large discrepancy between those two numbers, it is because the data collection is not being done properly.
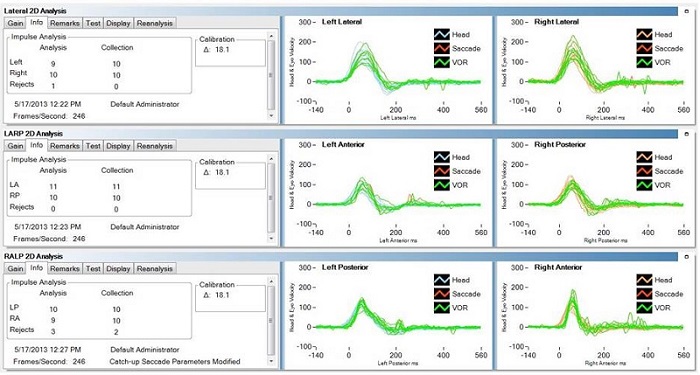
Figure 13. Analysis algorithms for lateral (top), LARP (middle) and RALP measurements. Each analyses shows to the number of analyzed responses, collected responses and rejected responses.
Gain
There are two ways to measure gain. Originally, we started with instantaneous gain. In this method, you look at the gain at a particular millisecond and then look at the head movement to the eye movement and calculate the gain. Based data collection and analysis, it was discovered that a bump artifact was occurring when using instantaneous gain, which interferes with gain calculation. We see bump artifact in everyone’s system, but we do not think the occurrence of the bump artifact is the same between the coils and the video head impulse.
This traditional vestibulo-ocular reflex gain measurement at peak head acceleration leads to falsely high gains when we compare the video recording to the coil recording. Before we released ICS Impulse, we changed the way we measured gain. Consequently, we no longer use instantaneous gain.
There are a few factors that can cause bump artifact. The first is loose goggles. Consider if the goggles were not tightened to the face, or if the person was touching the goggles or the goggle strap during the test. Perhaps the subject’s face shape does not fit the goggles well, such as when the person does not have much of a nasal bridge and there is a gap between the face cushion and the person’s skin. That is not a good goggle fit. Any gap between the goggle and the face can cause slippage. Is the person’s face particularly compliant? As we get older, the skin on our face gets a little bit looser. When we were doing our validation measures, we did have one subject that had a large bouffant hairstyle, and we had to explain this in the validation as to why that set of data was not as precise as some others. The new algorithm takes those things into account and can calculate the gain appropriately. Therefore, the data from the goggles will match the data to the coils.
It was decided that a more accurate gain measurement was possible when measuring gain over a wide window from the beginning of the head impulse until the head impulse returns to 0 degrees per second. This resulted in similar gain calculations between the video and the search coils. What we now use is what is called an area under the curve (Figure 14). We take the baseline of the head impulse to the 0 cross on the other side of the peak, and we calculate area under the curve for the gain measurement instead of using instantaneous gain.
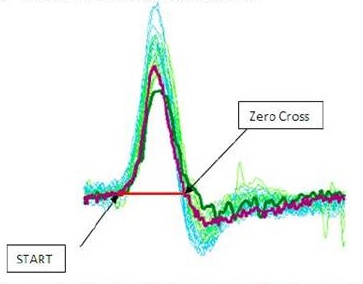
Figure 14. Area under the curve, from the starting point to the zero-cross for the head movement.
A long as you do not have a saccade in the middle of the head movement, you can calculate the area under the curve. Covert saccades during head impulses lead to falsely high vestibulo-ocular reflex gain values for both instantaneous gain and area under the curve. Therefore, the catch-up saccade needed to be first detected and excluded from the analysis. The gains calculated with desaccaded eye velocity were very similar to video and search coils and quite comparable to the traditional gain measurement method for coils around peak head acceleration. All of this is explained in this PLOS One article that was released in 2013 by the Australian group headed by Hamish MacDougall.
Figure 15 is an example of a covert saccade; I did not plot the head on here; this is eye movements only. The reds are the saccades and the green is the vestibulo-ocular reflex. We need to take out any saccades that occur during the head movement so that we can calculate the area under the curve. The desaccader is proprietary. But first we desaccade, and then we calculate the area under the curve to get our gain measurement.
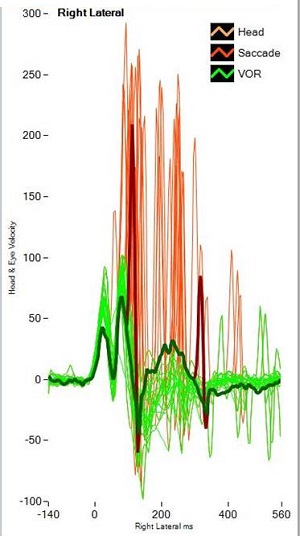
Figure 15. Example of covert saccade (red). Green= vestibulo-ocular reflex.
Both the hardware and the software were optimized to make sure that the data you obtain with the video head impulse system looks like the data you get with the gold-standard scleral search coils. The Impulse is the only device that has been validated for all six canals against the scleral search coils.
Training
Let’s talk about how we ensure that someone can do a proper head impulse. My training is as an audiologist, and when I went through the audiology program, no one taught me how to do a head impulse test. When we were starting up this project and evaluating the risks, the one at the top was, “Can we train people to do proper head impulses? Can we make sure that they collect good data?” Experts in Sydney collected thousands of head impulses for 20 years. Could we train our customers to do as good a job as they were doing? We wanted to make sure that we put things in to the system that helped you perform proper head impulses. We offer two features: training curves and operator feedback. We already talked about the training curve. When you do a head impulse, look at the training curve to see if your curve matches the training curve (Figure 16). If it does, you are going a good job. Note that these white dots are the velocity at which all the data has been collected. You can see the data is between 150 and 200 degrees per second, which is very good.
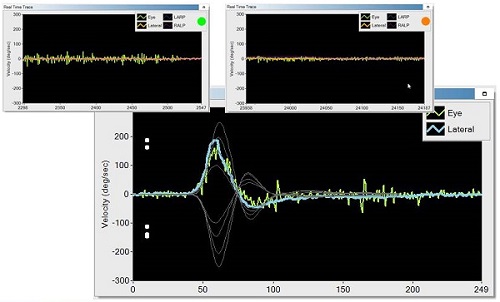
Figure 16. The bottom picture shows training curves; the white dots are the velocity at which the data is collected. Top pictures show the operator feedback.
We released the product first in Germany in 2011, then broadened into Europe, and we just released in the U.S. after we received FDA approval in February. In the very first release, we did not have operator feedback. In version 1.2, which is the only version the U.S. market has received, there is operator feedback. This means that when you perform a head impulse, you either see a green dot or an orange dot to indicate the acceptability of the recording. If you get a green dot, you are doing an excellent job. If you get an orange dot, it will tell you whether it was too slow or too much overshoot. Too slow is fairly self-explanatory; you are not moving the head quickly enough. Overshoot means you are coming back to the center too quickly after moving the head to one side. I do not want to move it quickly to the left and then bring it back to the other direction immediately. In that situation, I am stimulating the left canal and coming back and stimulating the right canal. That will not give an accurate side-of-lesion response because you are stimulating both canals. If the test is done well, you will see a green dot.
The other thing was the training materials. With this system, you are given a front-and-back guide which tells you step-by-step how to do the test with all the software steps. We also provide a training DVD on ICS Impulse. You can go to icsimpulse.com and view how to do a proper head impulse, from putting on the goggles to collecting the data. Also located on the site are more videos about analysis, video-only mode and reporting.
I also want to mention headimpulse.com. This is a Web site that contains the research behind the development of Impulse and also where we announce where researchers, including Halmagyi and Curthoys, are speaking on the head impulse. It also hosts a talk by Dr. Halmagyi that you can watch.
Performing a Proper Head Impulse
You can see several videos on exactly how to do a proper head impulse and how the software works on icsimpulse.com. One thing I would like to discuss is pupil detection. This was something that was improved between our VNG system and the ICS Impulse. The pupil detection works quite well in the ICS Impulse. You want to make sure that you have good pupil detection; it is analogous to having good impedance on an ABR to obtain a clear recording.
Figure 17 shows the region of interest (ROI) box. The pupil should be centered in the ROI box. The upper left box of Figure 17 shows the pupil detection, which either can appear as a white pupil with a black background or as grayscale. If you are recording with video, you would want to use grayscale. I like to use pupil location because it is easy to watch the eye tracking. When you put the goggles on the patient, 90% of the time it immediately finds the pupil and you do not have to do anything. If it does not immediately find the pupil, you click the auto-threshold button in the pupil detection box. If you need to adjust the view, you use the plus or minus buttons. Sometimes I have to tweak the image using the sliders when I move from lateral to LARP or RALP. You want to see that your eye trace is fairly small. In Figure 18, the green is the eye trace and the orange is the lateral head movement recorded from the gyroscopes. You want to see that the green (eye movement) is fairly small. It is important to track the pupil before you do your head impulse test. You also do not want any extraneous noise.
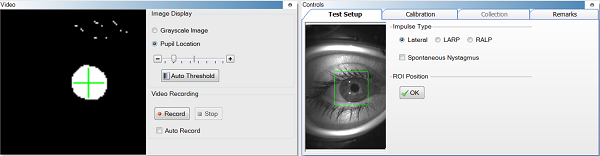
Figure 17. Region of interest (ROI) box (right panel), and pupil detection box (left panel).
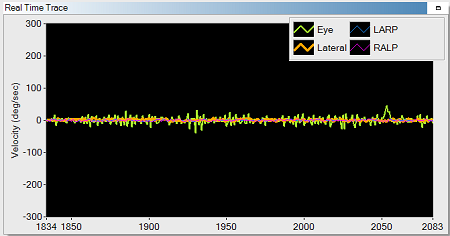
Figure 18. Real time trace of video recording; green=eye trace; orange=lateral head trace.
Setup and Calibration
The patient should be sitting one meter from a fixation dot with the goggles on and adjusted. In Figure 19, the fixation dot happens to be the Otometrics logo. We do supply you with these small stickers, but you can use anything. If you get closer than a meter to that fixation dot, then you have the issue of convergence, which means you are crossing the eyes, which can lead to an increase in gain. Two calibration lasers are built into the goggle. When the calibration starts, only one laser stays on and basically it makes a saccade shape: you look left, right, left, right, and it calculates the calibration. Then you do a calibration check. This is another feature that we built in to make sure that everything is done properly.
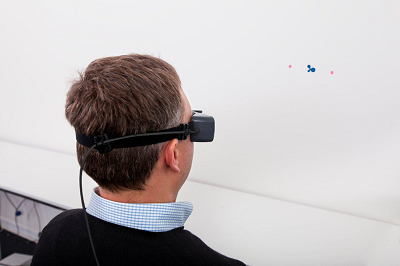
Figure 19. Patient sitting one meter from fixation dot during a calibration check.
The calibration check is a visual vestibulo-ocular reflex test. You have the patient look straight ahead at the fixation dot, and you slowly move their head side to side. As you are moving the head side to side, you are looking at the orange and green tracing (Figure 18). The orange and green trace will look like a sinusoid. Those two tracings should be lying on top of each other. If the green is lower or higher than the orange trace, then you know calibration is not good. If you are seeing catch-up saccades during that calibration check, there may be a cerebellar component. You should not be seeing catch-up saccades to a low-frequency head movement. If you do get catch-up saccades, you need to be aware of that and interpret your head impulse data appropriately.
In the calibration, we take two measurements for the left and two measurements for the right. They have to be within a certain number of pixels from each other, and then we look at the distance between the left and the right. It is very rare for you to have a bad calibration because the calibration criteria are fairly stringent now. If you do not meet these criteria, it will keep measuring the patient looking left and right until you do.
The other thing I want to point out is the head impulse maneuver. The blue tracing on the left in Figure 20 shows good data that I collected, and the orange tracing on the right is an example of poor data that I received. When we first released the ICS Impulse, we did not have the green and orange light system. Since we have implemented this system, I rarely get poor data anymore. If you look at a good head impulse recording, the head is moving up, there is peak energy around 250 Hz, and then it comes down. That is a very quick 10 to 15 degree head movement, and it stops. You are looking at a smaller movement for LARP and RALP because the head moves side to side much easier than it does up and down.
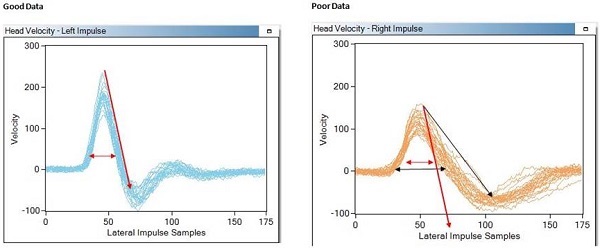
Figure 20. Tracings for head impulse maneuver, comparing good data (left, blue) to poor data (right, orange).
You want to do the head impulse at about 150 to 200 degrees per second. It is a very quick movement. You should have a very steep slope, and the distance between the front and the back of the peak should be fairly narrow. The orange tracing on the right of Figure 20 looks sluggish. It is a little on the slow side. It is still acceptable, although not very pretty. You want your data to look more like the one on the left of Figure 20. On icsimpulse.com, under See How it Works, you can see how to perform a proper head impulse.
Analysis
In the analysis of the data, you are going to see one of three things: normal tracings, overt catch-up saccades or covert catch-up saccades. The first, and most important thing you look for is the presence of catch-up saccades. The second thing you look at is the gain graph. The top panel of Figure 21 shows the gain graph for a normal patient. The orange tracing is the head, and the green is the eye. You can see that they are aligned on top of each other.
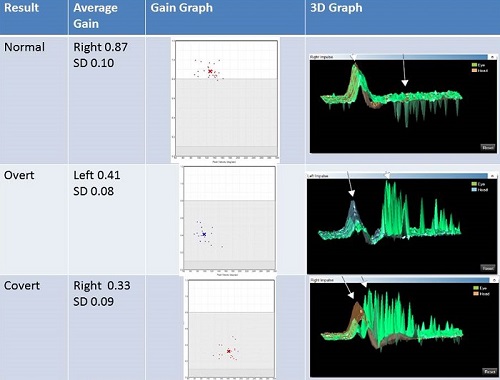
Figure 21. Gain graphs of normal tracings (top), overt saccades (middle), and covert saccades (bottom).
This patient’s left side was abnormal. The spikes shooting down in the tracing is spontaneous nystagmus beating downward (Figure 21, top). In the gain graph, you have data within normal limits. The white is normal range, light gray is a unilateral loss, and the dark gray is a bilateral loss. This is based on normative data that was collected by the Sydney group. If you want to collect your own normative cut-offs, you can do so. The gain for the normal patient is 0.87 with a standard deviation is 0.1; we do not see any catch-up saccades, and the gain is within normal limits.
The middle panel of Figure 21 shows an overt saccade. All of the catch-up saccades that appear as upward spikes are happening after the head movement has stopped. That is why these are overt catch-up saccades. The gain is 0.4, which is in the abnormal range, and you have the presence of overt catch-up saccades. That is not a normal response.
The last example is of covert catch-up saccades (Figure 21, bottom panel). Again, orange is the head movement and green is the eye movement. These catch-up saccades are happening during the head movement. There are some overt saccades recorded as well, but there are a fair number of covert catch-up saccades. The presence of catch-up saccades is abnormal. If we look at the gain from eye to head, we see that it is 0.33; this is abnormal.
Diagnostic Benefit
I am going to talk about diagnostic benefits and show you some more data on some patients with disorders. We think that the head impulse should be incorporated as one of the first tests because it is quick and easy to do. It will give you some idea of whether or not this patient has a central or peripheral disorder. If they have abnormal head impulses, that is a peripheral disorder. If the head impulses are normal and they have symptoms, then perhaps it is a central disorder. The head impulse test is the only test that can evaluate the anterior and posterior canals. Calorics can test lateral canals, but they cannot test the anterior and posterior canals. The head impulse is the first time we are able to easily test anterior and posterior canals in the clinic.
One nice thing about the ICS Impulse is that you can test acute patients. These are symptomatic patients who present in the emergency room and are not feeling well. We have many facilities testing these patients using the ICS Impulse. You can also test younger patients. The youngest patient I have tested was five years old. The goggles fit her, and she was very cooperative. Dr. Manzari has also tested a 4-year-old patient. If you can get the goggles on the patient and they fit appropriately without gaps between the skin and the goggle, then most children are willing to allow you to do a head impulse test. They are usually not compliant when it comes to calorics. The same goes for elderly patients. Many doctors do not like to do calorics on elderly patients. If you cannot do a caloric or you have elderly patients, then the head impulse is a good alternative.
It helps you determine if the disorder is affecting the inferior or superior branch of the nerve. You can test the anterior, posterior, and lateral canals. If you add this battery to vestibular myogenic evoked potentials (VEMP), cervical (c)VEMPS and ocular (o)VEMPS, you can know whether that person has inferior or superior vestibular neuritis. It helps determine if the disorder is occurring in the canal. One thing that has been mentioned, but not published, is that if you have a normal VEMP and you have an abnormal head impulse, then you can perhaps assume that the nerve is fine and there is a problem in the canal. If the problem is in the canal, then are we looking at a vascular disorder? There is much research to be done with the head impulse now that we have made it a viable clinical tool.
The next diagnostic benefit is that you can test the vestibulo-ocular at frequencies higher than caloric or rotary chair, in a range that is more typical for everyday use. Again, you can test young children. Because these goggles are so small and lightweight, they are very easy to get on a child. The other component of the ICS Impulse besides head impulse testing is a visual-only mode. You could use these goggles on a small child, even if they are not tight, in video-only mode to get some information about how their eyes are moving in response to stimuli.
There is also the ability to perform serial testing. When we are testing new products prior to a release, it is sometimes difficult to get enough volunteers for testing, as was the case for calorics on the new ICS AirCal. Luckily, with the head impulse test, I can test my colleagues over and over again. Patients do not mind it because it is a very comfortable test. It is easy to do serial testing in this way. You can even compare today’s test with tomorrow’s test and be able to monitor changes. This is substantial when you are looking at benefits of rehab and compensation, such as when monitoring gentamicin treatments. Whether you are giving gentamicin because they need it to stay alive or because it is a Meniere’s patient and you are trying to kill the organ, you can monitor the effects of the drug using this test. There have been a couple of vHIT articles on the effects of gentamicin post treatment.
Head Impulse vs. Calorics
Both the head impulse and caloric are ear specific. The head impulse detects abnormalities in all six canals, where the caloric only detects abnormalities in the lateral canal. The head impulse test uses stimuli that replicate how the patient uses it in everyday life. The caloric evaluates at low frequency, approximately 0.025 Hz. With the head impulse, the stimulus does not persist between tests. That means I can do one head impulse and then turn around do another head impulse. With the caloric, the stimulus can persist between irrigations, especially if not performed properly. This is why we always say wait three to five minutes between each temperature on each ear.
With the head impulse, you have the ability to test patients even if they have middle ear disorders. With the caloric, middle ear disorders affect the results, and we have to interpret the data carefully. Obviously, if they have a tympanic membrane perforation, you can use air, but not water. With the head impulse, none of these things come into effect. You can test all patients with middle ear disorders.
Lastly, with head impulse, you have the ability to test patients who will not tolerate calorics, such as young children, elderly patients or patients with severe hearing loss. As we do know, there are patients who do not tolerate calorics.
Head Impulse vs. Rotary Chair
We often couple calorics and the Rotary Chair test together. The advantage of the rotary chair and why it is often paired with calorics is because you can test patients with middle ear disorder on the rotary chair. You can evaluate difficult-to-test patients, including young children or patients who will not tolerate calorics. The rotary chair could give us more information in those two populations. You could distinguish between a bilateral vestibular lesion and false positive caloric reduction.
Let’s say the person has a very curvy ear canal and the stimulus is not getting down to the eardrum. This can lead to results that show a bilateral caloric weakness. You would then use the rotary chair to confirm or disprove that diagnosis. We use the rotary chair to evaluate changes in vestibulo-ocular function over time. People are more compliant to do repeated rotary chair than they were to have a caloric over and over again. If you had a chair that would go off axis, you then had the ability to test utricular function. We now have oVEMPs as an option for utricular function.
With the Impulse, you get all the advantages of a rotary chair. You can test patients with middle ear disorders and those who are difficult to test or would not tolerate a caloric. You can distinguish between true bilateral vestibular lesions and false-positive caloric reduction. You are going to be able to see if it is a bilateral loss versus a unilateral loss. You can evaluate changes over time with serial testing, and you can test visual vestibular interaction.
One disadvantage of the rotary chair is that it tests both canals simultaneously. It is not ear-specific or side-of-lesion specific. The vHIT is side-of-lesion specific. The rotary chair only detects cases of peripheral loss in the lateral semicircular canal. The rotary chair is mostly insensitive to common vestibular lesions, which are mostly unilateral in origin. The ICS Impulse can identify unilateral and bilateral disorders. A rotary chair can result in adverse reactions. There are no adverse reactions with vHIT or ICS Impulse, even in acute patients. The rotary chair provides total body rotation. It assumes the head is completely fixed and that the stimulus delivered to the body is the same as what is delivered to the head; this assumption becomes unreliable at frequencies above 1000 Hz. Again, with ICS Impulse, we are testing at frequencies similar to everyday movement, which is about 4000 Hz.
The physical space needed for rotary and the cost of the equipment can be a limitation. The Impulse is very portable. You can have it in the clinic; you can have it in the emergency room. You can take it wherever you want, and it is much less expensive than a rotary chair.
Complete Test of the Peripheral Vestibular System
Let’s look at the complete test of the peripheral vestibular system (Figure 22). The superior nerve goes to the utricle and the anterior and lateral semicircular canals. The inferior nerve innervates the posterior canal and the saccule. A healthy person would have a normal response to lateral, anterior, and posterior head impulses and would have a normal response to oVEMP and cVEMP. If you have a person with superior vestibular neuritis, you will have an abnormal lateral or horizontal head impulse, an abnormal anterior head impulse, and an abnormal oVEMP. If you have inferior vestibular neuritis, you would have an abnormal cVEMP and an abnormal posterior head impulse. If it is a unilateral loss, you will see abnormality for that whole side on all tests.
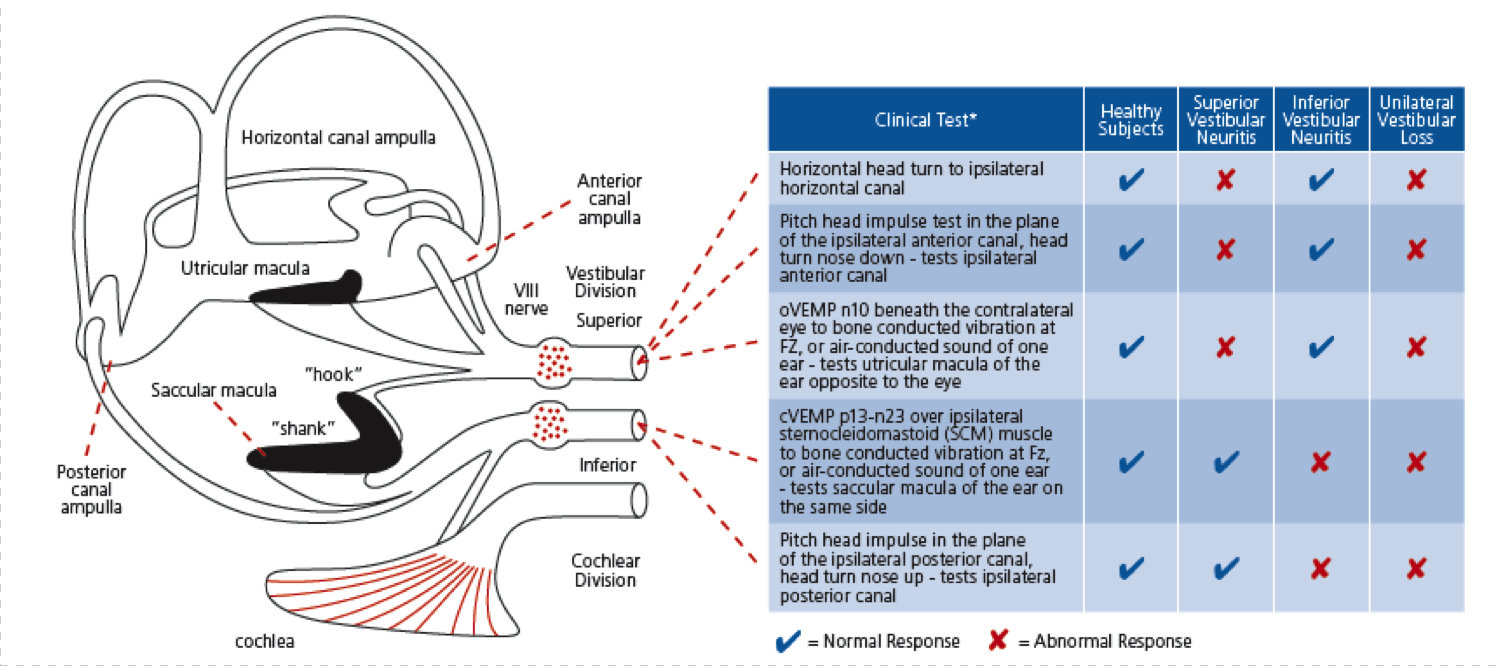
Figure 22. Tests of the peripheral vestibular system and the corresponding anatomy.
Figure 23 is an example of a left unilateral loss on the ICS Impulse. As a reminder, LARP is left anterior right posterior and RALP is right anterior left posterior. On the right side, there are no catch-up saccades and the gain is all within the white region. That is normal. The left side, however, shows beautiful catch-up saccades in the lateral, anterior and posterior canals, and we have reduced gain in all three. That is the typical unilateral loss.
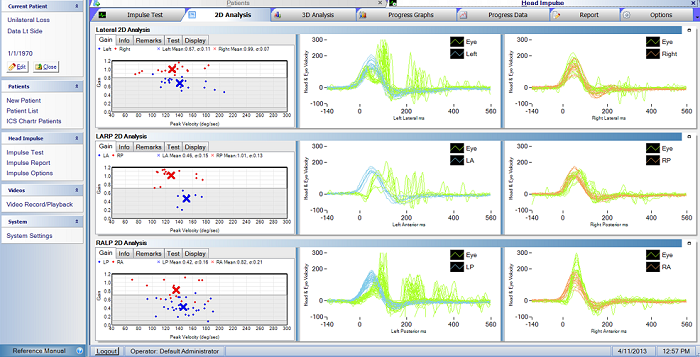
Figure 23. Left unilateral loss as recorded by the ICS Impulse.
Figure 24 shows a bilateral loss in 3D view. You can rotate the 3D view by using your mouse. Halmagyi says, “Look for the canyon.” The blue is the head movement and the green is the eye movement. You see this black hole or this canyon in between, which shows us low gain. We have beautiful catch-up saccades in the left and right sides for all three canals. You can see the canyon in all these. In Figure 24, orange is the head, green is the eye for the right side; blue is the head, green is the eye on the left side. If we look at the gain, it is all in the abnormal region. This is a typical bilateral loss.
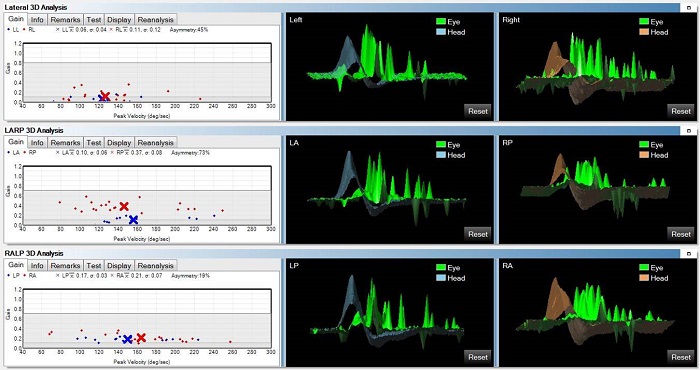
Figure 24. Bilateral vestibular loss as recorded by the ICS Impulse.
Figure 25 is an example of a left superior vestibular neuritis. In viewing the right side, there are no catch-up saccades and gain is normal. On the left side, the lateral canal has catch-up saccades, the anterior canal has catch-up saccades, and the posterior canal looks normal with normal gain as well. For the left lateral and the left anterior canals, we have an abnormal response. To refresh your mind, the superior nerve innervates the lateral canal and the anterior canal and utricle. That is why it is an example of superior vestibular neuritis.
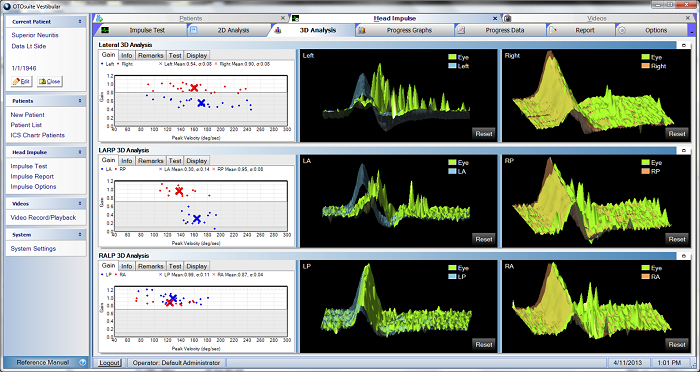
Figure 25. Left superior vestibular neuritis in gain (left), 2D (middle) and 3D (right) analyses.
Figure 26 is an example of inferior vestibular neuritis. The inferior nerve innervates the saccule and the posterior canal. On the left side, there are no catch-up saccades and gain is all normal. On the right side, there are no catch-up saccades to the lateral or anterior canals, but we do see catch-up saccades in the posterior canal. Gain is normal for the lateral and anterior canals, but the gain for the right posterior canal is abnormal, as noted by the red marks in the gray area of the gain graph. Inferior vestibular neuritis only affects the posterior canal on the right side, and the cVEMP should be abnormal.
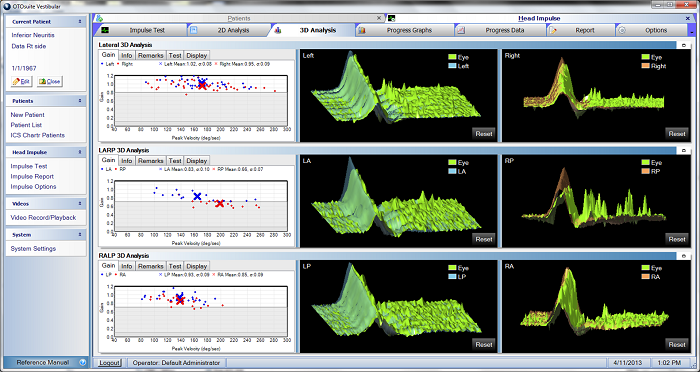
Figure 26. Right inferior vestibular neuritis in gain (left), 2D (middle) and 3D (right) analyses.
I want to talk about Meniere’s disease. Figure 27 shows a customer of ours who is an audiologist. She asked me to test her. She was diagnosed with Meniere’s since 10 years of age, and she had had a neurectomy on the left side. On her left side, we see these beautiful covert catch-up saccades; they are happening during the head movement. She does have some overt catch-up saccades as well. We also have a reduction in gain on the left side.
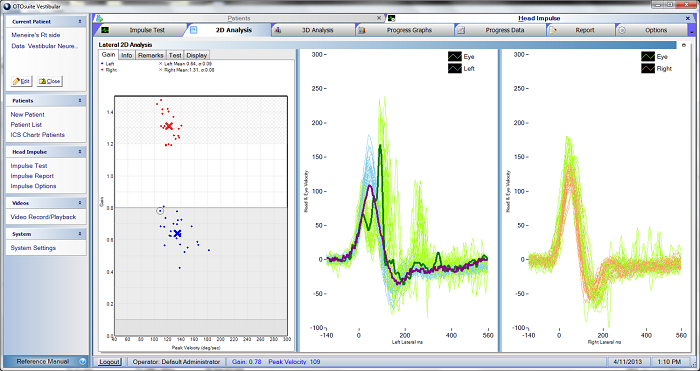
Figure 27. Results from a patient with left neurectomy subsequent to right-sided Meniere’s disease.
On the right side (Figure 27) you see that the eye movement (green) is larger than the head movement (orange). That is unusual. There is an increase in gain. Her gain measurement on that side is 1.31. This is not an uncommon pattern that we are now seeing in Meniere’s patients; however, we also have seen is that it does not happen with every Meniere’s patient. The question is if every Meniere’s patient is exactly the same. When you have a new tool that you can use clinically, such as the head impulse test, we start to learn more about these diseases. I would advise you to look into the articles published by Dr. Leonardo Manzari and colleagues (Manzari, MacDougall, Burgess, & Curthoys, 2013; Manzari, et al., 2011) and read about the Meniere’s patients for further information.
Documenting Compensation
There is a great deal of interest from our physical therapists as well as our audiologists, neurologists, and ENTs, to see if rehab is working for these patients. There is more research that needs to be done, but Michael Schubert from Johns Hopkins and several colleagues from Emory published a study on compensation back in 2009. They were using search coils, but it gives you some idea about compensation in the head impulse test. There is the thought that when the person is acute, they have overt saccades. As therapy starts working and as compensation starts to happen, the patient will move from having overt to covert saccades. That is very interesting.
Some researchers have also looked at active versus passive head impulses. Again, we need more data in this area. Because vHIT is easy to perform serially, we can obtain quality information on how compensation is occurring, confirm or deny previous notions we may have had about compensations and learn some new things as well.
We also get questions from ENTs about how vHIT affects patients’ treatment. One ENT noted to us that the head impulse can tell him within seconds (qualitatively) or minutes (quantitatively) if the patient has a dramatic loss of function. It helps decide whether to refer the patient for physical therapy or make the distinction whether or not the patient is having a stroke. The vHIT is a pure test of peripheral function. Many patients that present to ENTs with dizziness are put through a series of tests to determine if their site of lesion is central or peripheral.
The head impulse test is impervious to many of the issues present with calorics. While all of us believe the caloric is the gold standard, I think we could all agree that it has its limitations. Do we make sure the person truly has nothing on which to fixate when we are doing the caloric so they are not suppressing the response? Other factors affecting the response of the caloric include attention, temperature transfer, delivery of the stimulus to the eardrum and central compensation. These issues do not affect the vHIT. There is less chance of variability on the vHIT than on rotational chair and calorics. There is astounding variability when we directly compare rotational chair and caloric responses in the same person, leading to many improper diagnoses.
The vHIT is much more quantitative than any other method currently available. We are not saying to throw everything else out; we are not saying that this is going to replace your calorics or your rotary chair today. We are saying that the head impulse has several advantages over these other two tests. Some people believe that you can use calorics for low frequencies, rotary chair for mid frequencies and head impulse for high frequencies. I believe that we should start with the head impulse to help guide us to what other tests are needed. We know that billing is becoming an issue, and we are not going to be able to do every test on every patient and be reimbursed. We need to be careful as to when and why we use certain tests so that can we justify what we are doing for reimbursement. I recommend Dr. Robert Fifer's recent AudiologyOnline course on reimbursement for more information.
ICS Impulse is the only vHIT system approved by Ian Curthoys and Michael Halmagyi and the Sydney team. I also wanted to mention that we are offering several courses over the next year. You can go to www.otometrics.com/impulse and sign up for these courses. We have some fantastic speakers, including Dr. Jorge Kattah who is a neuro-ophthalmologist, Kristen Janky, Ph.D. from Boys Town who is Director of Research for their vestibular clinic, and Dr. Faith Akin and Dr. Owen Murnane from VA Mountain Home, who have published several studies related to VEMP and head impulse research as well. We invite you to learn more from these individuals at these courses.
In your handout, you have a diagnostic booklet which talks about all of these analyses and disorders. The diagnostic booklet was written by many ENTs, neuro-ophthalmologists and neurologists. These resources should give you more information on today’s topic.
References
Halmagyi, G. M., & Curthoys, I. S. (1988). A clinical sign of canal paresis. Archives of Neurology, 45(7), 737-739.
Halmagyi, G. M., Weber, K. P., Aw, S. T., Todd, M. J., & Curthoys, I. S. (2008). Impulsive testing of semicircular canal function. In C. Kennard & R. J. Leigh (Eds.), Using eye movements as an experimental probe of brain function (pp. 187-194).
MacDougall, H. G., Weber, K. P., McGarvie, L. A., Halmagyi, G. M., & Curthoys, I. S. (2009). The video head impulse test: Diagnostic accuracy in peripheral vestibulopathy. Neurology, 73(14), 1134-1141. doi: 10.1212/WNL.0b013e3181bacf85
MacDougall, H. G., McGarvie, L. A., Halmagyi, G. M., Curthoys, I. S., & Weber, K. P. (2013). The video head impulse test detects vertical semicircular canal dysfunction. PLOS one 8(4), e61488. doi: 10.1371/journal.pone.0061488
Manzari, L., Burgess, A. M., MacDougall, H. G., Bradshaw, A. P., & Curthoys, I. S. (2011). Rapid fluctuations in dynamic semicircular canal function in early Ménière's disease. European Archives of Otorhinolaryngology, 268(4), 637-639. doi: 10.1007/s00405-010-1442-5
Manzari, L., MacDougall, H. G., Burgess, A. M., & Curthoys, I. S. (2013). New, fast, clinical vestibular tests identify whether a vertigo attack is due to early Ménière's disease or vestibular neuritis. Laryngoscope, 123(2), 507-511. doi: 10.1002/lary.23479
Schubert, M. C., Hall, C. D., Das, V., Tusa, R. J., & Herdaman, S. J. (2009). Oculomotor strategies and their effect on reducing gaze position error. Otology & Neurotology, 31(2), 228-231. doi: 10.1097/MAO.0b013e3181c2dbae
Weber, K. P., Aw, S. T., Todd, M. J., McGarvie, L. A., Curthoys, I. S., & Halmagyi, G. M. (2008). Head impulse test in unilateral vestibular loss: Vestibulo-ocular reflex and catch-up saccades. Neurology, 70(6), 454-463. doi: 10.1212/01.wnl.0000299117.48935.2e
Cite this content as:
Crumley-Welsh, W. (2013, July). ICS Impulse – revolutionizing vestibular assessment. AudiologyOnline, Article 12003. Retrieved from: https://www.audiologyonline.com/