Various surveys of audiologists have recently been conducted in the industry as reported by Prendergast and Kelley (2002), Strom (2001), and Plumb (1998), where they looked at the demographics of audiologists and their practice. Information about ourselves and our practice can be helpful in making business decisions, and perhaps providing better services to our patients.
The basis for information in this survey was a questionnaire developed by this author to explore various relationships among factors that might be influential in audiology practice. Cross-tabulations were calculated and a number of associations were revealed. This paper will present some of these findings and discuss their possible implications.
METHOD:
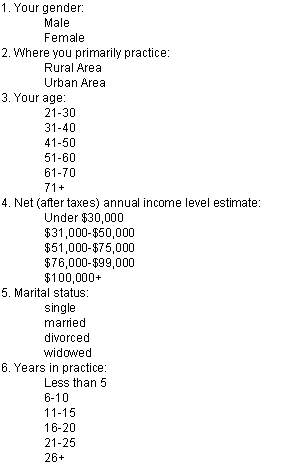
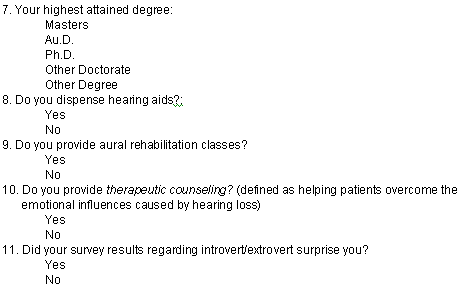
There were two hundred and thirty-nine responses to the survey. Respondents with incomplete questionnaires were removed, and subsequent questionnaires submitted more than once by a respondent were removed. The final total included for analysis was n=217. Figure 1 shows the 11-point questionnaire
AudiologyOnline hosted the survey for audiologists invited to participate within a timeline of approximately two weeks during February 2002.
It should be noted that the present survey population may not necessarily be representative of all audiologists. However, the data collected in the survey is descriptive of the large population that answered the survey.
FIGURE 1: Respondents were required to complete this questionnaire online.
RESULTS:
Data were collected and cross-tabulations were established using a variety of questions from the survey instrument. This paper will include only those findings that appeared most interesting to the author.
Female audiologists in the survey population tended to be between ages 31 and 40, while males tended to be between 41 and 50. Table I shows cross-tabulations for age and gender. When undifferentiated for gender, most practicing audiologists were between ages 41 and 50 (33.6 percent of the total).
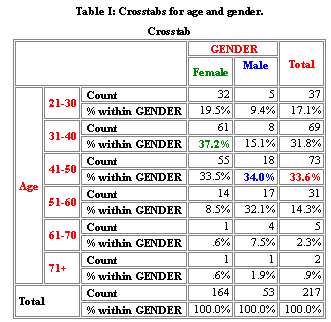
Table II shows the inverse of Table I, with cross-tabulations for gender and age. There was a ratio of almost 5:1 female audiologists among respondents under age 50, and a majority of audiologists over age 50 were male.
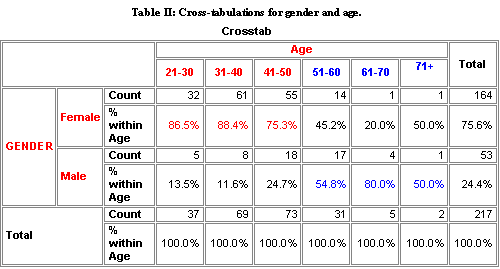
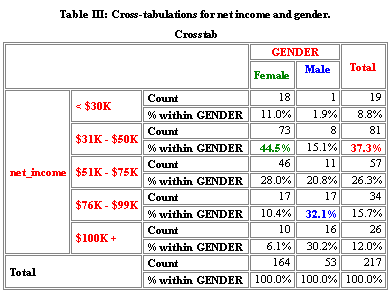
Table III shows cross-tabulations for net income and gender. There were collectively more than three times as many female respondents than males in the survey. More female audiologists earned less than $75,000 annually than male audiologists, but the population earning more than $75,000 was dominated by a greater percentage of male audiologists. By bracket of income, most audiologists in the survey population tended to earn between $31,000 and $50,000 annually. This is consistent with a report by Strom (2001) identifying the average income for a dispensing audiologist as $49,810. Fifty-five and one-half percent majority of women in the field in this survey reported earning less than $50,000 annually while 83.1 percent of men reported earning more than $50,000.
Tables IV shows cross-tabulations for marital status and gender; Table V shows cross-tabulations for marital status and age. A preponderance of all respondents across both genders and all ages reported being married. Table V shows that while most audiologists were married, a larger proportion of older rather than younger audiologists (31+) were married.
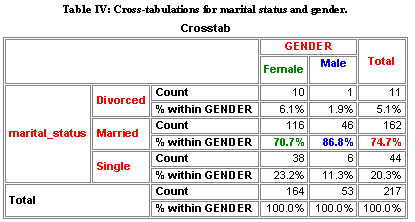
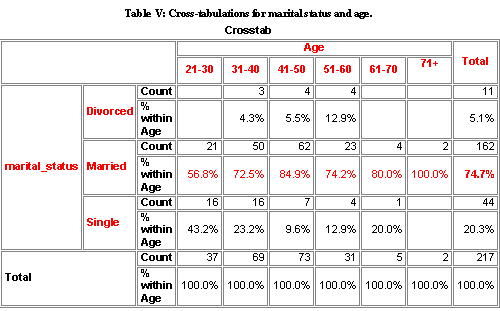
Table VI shows cross-tabulations for years in practice and gender. It reveals that women are more represented among people practicing less than twenty years, while men are a greater proportion of the group practicing twenty-one years or more.
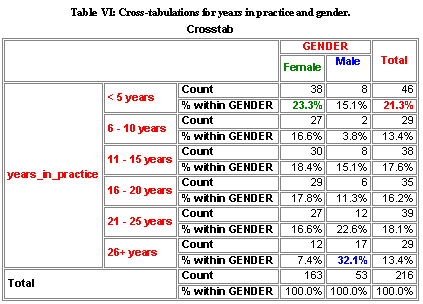
Table VII shows cross-tabulations for highest attained degree and gender. With respect to highest degree attained, 73.8 percent of women and 45.3 percent of men reported holding a Masters Degree; 20.7 percent of women and 30.2 percent of men reported holding an Au.D.; 3 percent of women and 18.9 percent of men reported holding a Ph.D.
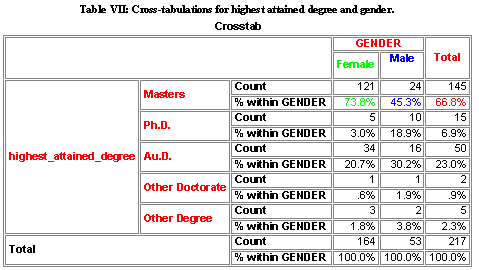
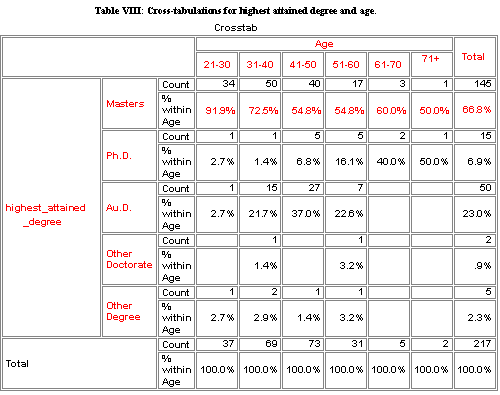
Table VIII shows cross-tabulations for highest attained degree and age, revealing a preponderance of respondents between ages 21 and 70 hold a Masters Degree. A total of 23 percent of all respondents held an Au.D.
Tables IX and X reflect similar information. Table IX shows cross-tabulations for dispensing audiologists and gender. It can be seen that 85.3 percent of all respondents dispensed hearing aids.
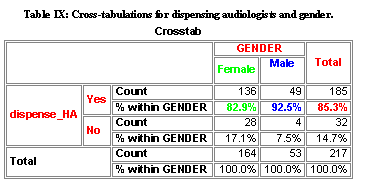
Table X shows cross-tabulations for dispensing audiologists and age. At least 80 percent of men and women, and audiologists of all ages, dispensed hearing aids.
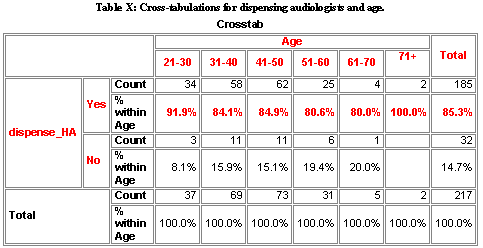
Table XI shows cross-tabulations for provision for aural rehabilitation and gender. As seen, three-quarters of practitioners did not provide aural rehabilitation services.
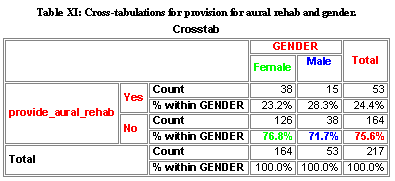
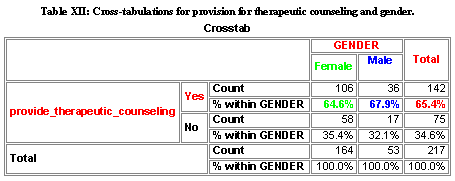
Table XII shows cross-tabulations for provision of therapeutic counseling and gender. Most audiologists (65.4 percent) reported providing therapeutic counseling despite Table XI's reported results that most practitioners did not offer aural rehabilitation (regardless of gender).
There was no significance found in:
- the relationship between age and area of practice;
- years in practice and primary area of practice (urban/rural);
- highest degree attained and primary area of practice;
- net income and age;
- age of practitioner and whether or not one provided aural rehab.
Tables XIII shows cross-tabulations for provision for aural rehabilitation and primary area of practice. There was no difference in the provision of aural rehabilitation services based on urban versus rural areas of practice.

Table XIV shows cross-tabulations for provision of therapeutic counseling and primary area of practice. Despite one's area of practice (urban/rural), most practitioners did offer therapeutic counseling.
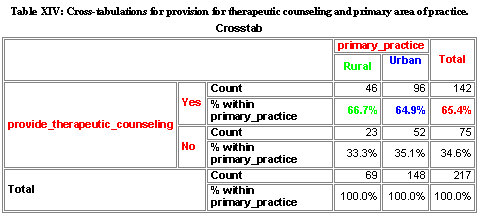
Table XV shows cross-tabulations for highest attained degree and net income. It reveals a preponderance of those earning up to $75,000 hold Masters Degrees. Those who earn $100,000 or more are rather evenly split between those who hold Masters (42.3%) and Au.D.s (38.5%).
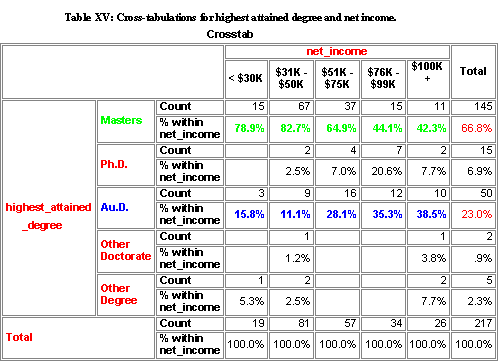
Table XVI is the inverse of Table XV. It shows net income and highest attained degree. People holding doctoral level degrees (Ph.D., Au.D., and Other Doctorate) earn more money than audiologists holding Masters (although the n for Ph.D.s and other doctoral degrees was too small to make a definitive statement). Of those who earned between $31,000 and $50,000, 82.7 percent held a Masters, the range where a preponderance of audiologists reported earnings. Also, of people holding a Masters, 71.7 percent made between $31,000 and $75,000. It is clear from those in the survey that despite the doctoral degree, those holding a doctorate reported earning more than Masters level respondents.
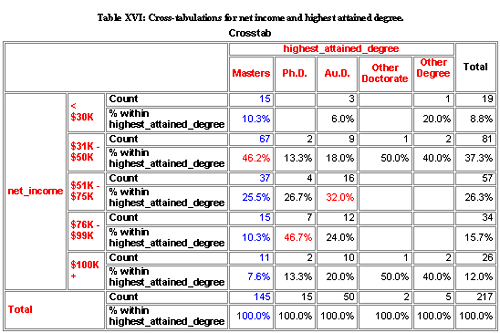
Table XVII shows cross-tabulations for highest attained degree and years in practice. It can be seen that two-thirds of respondents held a Masters Degree.

DISCUSSION AND CONCLUSIONS:
Table III is consistent with data collected from 7,900 American Academy of Audiology members, as reported to this author by Ed Sullivan (2003). Sullivan's survey reported a ratio of approximately 3:1 female audiologists to male. Table III shows a disproportionately lower earning power among women. In the present survey, significantly more than 50 percent of men earned $51,000 or more annually while over 50 percent of women did not exceed $50,000 annually. This discrepancy in earning power is consistent with previously published national reports. According to the US Census (2000), working women over age eighteen earn substantially less than men.
Also noted is that it could be heartening to realize that a significantly larger proportion of audiologists (74.7 percent) reported being married than would be found in the general population (about 50 percent). Perhaps this says something about the field as conducive to family life, or offering a stable family environment.
Table XV shows when highest attained degree was the dependent variable relative to net income, people earning less than $75,000 were very likely to have a Masters degree. In the $31,000 to $50,000, a significant percentage (82.7 percent) of respondents held a Masters relative to all other possible degree holders. In the $76,000 to $100,000 income, men and women are evenly split. In the very high income levels with reported earnings of $100,000 or more, men dominate the category 62% to 39%. However, with respect to the inverse relationship as shown in Table XVI where net income was the dependent variable and highest attained degree was the independent variable, those with doctoral level degrees commanded greater income.
It is noteworthy from Table VI that women now dominate the profession by numbers, whereas twenty-five years ago, it was male dominated. Therefore, it might be speculated that the dominance in the over $100,000 income range by males could be attributable to the fact that they have been practicing longer, and are therefore more established.
Table XVIII is a comparison between the present survey and one conducted five years earlier by Plumb (1998). It should be noted that Plumb presents average income in actual dollars while the present survey collected income by salary ranges. In the current survey, there is no meaningful difference in the range of median income among urban and rural practitioners.
Table XVIII also indicates that urban income data in the present survey is consistent with Plumb. Plumb's rural income average is slightly lower than found in the current survey. It might be speculated that time has somewhat improved rural salaries.
Table XVIII: Comparison of present survey data to Plumb (1998) survey.

Table XVII shows that three-quarters of respondents held a Masters Degree; almost a quarter held an Au.D. More Masters would be expected due to its longer prevalence in the profession than the Au.D. However, this table also shows that the longer the years in practice, the more likely audiologists were to hold an Au.D., except for audiologists in practice 26 years or longer. This could suggest that the longer one is in practice, the more likely one is to pursue an Au.D.
Table XI is enlightening in its absence of gender dominance in the provision of aural rehabilitation. While only about a quarter of respondents reported offering aural rehabilitation, Table XII shows a preponderance (two-thirds) of audiologists reported providing therapeutic counseling. This suggests that audiologists may consider their efforts in counseling make up for their need to offer aural rehabilitation. Therapeutic counseling was specifically defined in the questionnaire as, "Helping patients overcome the emotional influences caused by hearing loss." This implies that we are not talking about providing informational counseling—that is, discussion of their audiograms or hearing loss—but addressing the dynamic elements that produce disability. Future research questions must specifically address in depth just how audiologists perceive they are offering therapeutic counseling. What mechanisms or techniques do they use to attain their counseling objectives?
Prendergast and Kelley (2002) conducted a survey on aural rehabilitation and counseling. They reported a combined 5 percent of respondents providing aural rehabilitation with an additional 16 percent who offered individual or group sessions. Their total of 21 percent is consistent with the present survey findings of 24.4 percent. Prendergast and Kelley's conclusions of time restraints was the primary barrier to offering aural rehabilitation, consistent with Ross (2000), and yet the need to provide these services is apparent, consistent with Schow, Balsara, Smedley and Whitcomb (1993).
SUMMARY:
If the present survey is reflective of audiologists as a group, we seem to be made up largely of women under age 50 and men over age 50, earning between $31,000 and $50,000 annually. The very low wage earners are female and the very high wage earners are male. We tend to be married, most of us hold a Masters Degree, and the longer we are in practice, the more likely we will be inspired to seek an Au.D. We tend to practice in urban settings, dispense hearing aids, and while we do not offer traditional aural rehabilitation, we do provide therapeutic counseling in our practices.
REFERENCES:
Plumb S. 1998 salary survey results. Advance for Audiologists 1998. www.advanceforaudiologists.com.
Prendergast SG & Kelley LA. Aural rehab services: survey reports who offers which ones and how often. The Hearing Journal 2002; 55(9):30;34-35.
Ross M. Profiles in aural rehabilitation: Richard Carmen interviews Mark Ross. The Hearing Journal 2000; 53(3):54;59-60;62.
Schow R, Balsara N, Smedley T, & Whitcomb C. Aural rehabilitation by ASHA audiologists:1980-1990. AJA 1993; 2(3): 28-37.
Strom KE. The HR 2000 dispenser survey. The Hearing Review 2000; 8(6): 20; 22; 24-25; 28-32; 36-37; 40; 42.
Sullivan E. February 12, 2003 personal communication regarding profiles of 7,900 members of The American Academy of Audiology from the July/2002 database.
United States Census 2000. www.census.gov.
ACKNOWLEDGEMENTS
I wish to personally thank all the audiologists who took the survey, entrusting our group with their highly confidential information. I am also grateful to the following professionals for their meaningful contributions:
- Douglas L. Beck, Au.D., President of Audiology Online, San Antonio, Texas, for his graciousness in offering this unique opportunity to stage the survey through participating audiologists;
- Frederic I. Solop, Ph.D., Director, Social Research Laboratory, Northern Arizona University, Flagstaff, Arizona, for running all cross-tabulations and overall statistical analyses;
- Tabitha C. Parent-Buck, Au.D., Chair of Audiology, Arizona School of Health Sciences, Phoenix, Arizona, for inviting all audiologists in the ASHS Program to participate in the survey;
- Brent G. Rasmussen , Educational Programmer/Analyst, WebCT Support and Development, Arizona School of Health Sciences, Phoenix, Arizona, for formatting the questionnaire and answer sheet; and
- Auricle Ink Publishers for funding this project.
Dr. Carmen is a frequent contributor to audiology journals, is Publisher at Auricle Ink Publishers, and Editor of and Contributor to the nationally popular Consumer Handbook on Hearing Loss & Hearing Aids: A Bridge to Healing. He is in private practice in Sedona, AZ, and may be reached by e-mail at rcarmen27@yahoo.com.

