
Dennis L. Burrows, Ph.D., Constance Brown Hearing and Speech Center, Kalamazoo, MI
Willis Owen, Ph.D., Department of Biostatistics and Epidemiology, University of Oklahoma Health Sciences Center, Oklahoma City, OK
BackgroundThe universal screening of newborn hearing in the United States has been discussed for many years. Downs and Sterritt1 first described a universal newborn hearing screening program in 1964. Although their screening methodology was behaviorally based, their efforts marked the beginning of early identification for hearing loss in the hospital nursery. Since that time there have been many attempts at universal newborn hearing screening with most being plagued with procedural and cost concerns. In 1993 the release of the National Institutes of Health Consensus Statement on Early Identification of Hearing Impairment in Infants and Young Children2 prompted a resurgence of interest in universal newborn hearing screening (UNHS). To date, twenty-five states have mandated UNHS covering approximately 1000 hospitals and affecting over 35% of all live births in the United States3. Twenty-two state mandates have occurred during the past three years with this past year (1999) being the busiest legislative season for mandated UNHS.
Prevalence of Hearing Loss at Birth
Estimates of the prevalence of newborn hearing loss range from 1.3 per 1,000 to almost 6 per 1,000 live births.4-10 The definition used to describe the hearing loss and the population being studied explains much of the discrepancy in prevalence data. For example, if one includes infants from both the well-baby and neonatal intensive care unit and defines the hearing loss to include unilateral hearing loss, a higher prevalence rate could be expected. Despite the prevalence rate used, the relatively low incidence of permanent sensorineural hearing loss in the newborn population would suggest that smaller UNHS programs might not discover a newborn with a sensorineural hearing loss (SNHL) for some time. A simple binomial probability distribution provides evidence for this conclusion.
Binomial Probability
Estimation of population values based on a single number calculated from a sample is called point estimation. Point estimation does not usually give enough information and does not maximize the information available from the data. Interval estimates, on the other hand, are usually more satisfactory because they quantify the uncertainty due to randomness. Interval estimates also provide more information on which to base decisions than is available from point estimates. Familiarity with confidence intervals is common in the scientific community. These intervals quantify the information available about a population parameter such as the mean. For example one may have data that gives a point estimate of 90% for the five-year survival rate from a certain type of cancer. Most people feel that saying the we are 95% confident that the survival rate is between 85% and 95% gives more information than the simple point estimate alone.
Several other types of statistical intervals have been developed. Prediction and tolerance intervals are not as well known as confidence intervals. A tolerance interval is an interval that will, with a specified degree of confidence, contain a given proportion of the population in question. A prediction interval is an interval that will, with a specified degree of confidence, contain the value of a pre-specified random observation from the population. In particular, prediction intervals can predict, with a given level of confidence, an upper and lower bound for the number of occurrences of an event that could be expected. The method used here is based on the normal approximation to the binomial distribution. This method gives the normal approximation prediction interval for the number of positives observed in a sample. This method was developed by Hahn and Nelson14 in 1973 and presented in Hahn and Meeker15. Because this method depends only on the sample and the percentage points of the normal distribution, it is easy to program the method using Microsoft Excel™. One might think that an interval based on the Poisson distribution might be better; however, this is not the case in this application. The interval based on the Poisson is much more difficult to calculate. Moreover, because we are interested in predicting the count of the number of positive tests, we have rounded the upper and lower bounds of the prediction intervals to the nearest integer. After the rounding has been done, there is no difference observed between the intervals based on the binomial distribution and the intervals based on the Poisson distribution. Because of this, the method employing the normal approximation to the binomial is reported here.
Results
For the purposes of explaining the theoretical binomial probability distribution model for assessing a UNHS program, the prevalence rate for sensorineural hearing loss was set at 3 per 1,000 live births. This prevalence rate was chosen based on a sampling of the literature4-10 and appears to be a reasonable estimate of significant permanent hearing loss in the newborn population. Sensitivity and specificity was set at 95% and 85%, respectively. Although the various test methods (AABR, TEOAE, and DPOAE) have reportedly different sensitivity and specificity, the values used for this model represent a conservative estimate of the reported sensitivity and specificity data published8,9,11-13.
Tables (based on a 95% level of confidence) are provided that indicate the expected number of true positive tests observed given a 3/1000 prevalence and a particular number of infants tested. To use these tables, find the annual birth rate of interest and the number of infants tested. The upper bounds of the 95% confidence interval represents the highest number of positive test results likely while the lower bounds of the interval is the lowest number of positive test results expected. For example, given an annual birth rate of 5,000, and having tested 5,000 newborns, one could expect, with a 95% level of confidence, to have found 0 to 17 newborns with a permanent SNHL.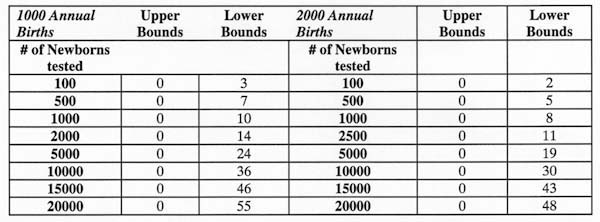
Table 1. Upper bounds and lower bounds of expected true positives for permanent sensorineural hearing loss among newborns based on 1000 and 2000 annual hospital births.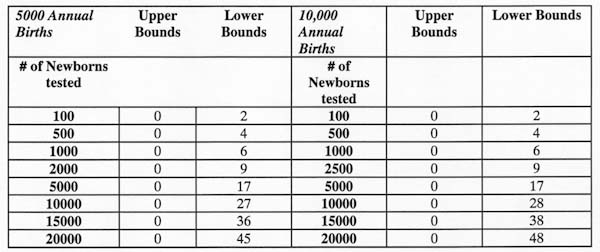
Table 2. Upper bounds and lower bounds of expected true positives for permanent sensorineural hearing loss among newborns based on 5000 and 10000 annual hospital births.
Summary
As more UNHS programs are developed in the United States, it is likely that smaller hospitals will go for many months without discovering a newborn with a permanent SNHL. A simple binomial probability distribution analysis confirms this observation. Smaller UNHS programs could conceivably test 20,000 infants before discovering their first infant with a permanent SNHL. The data presented here is not intended to discourage implementing a UNHS program but instead help assess the program. A knowledge of the binomial distribution for hearing loss could help the UNHS program administrator understand the patterns of discovering permanent SNHL in newborns.
References
- Downs, M.P. and Sterritt, G.M. (1964). Identification audiometry for neonates: A preliminary report. Journal of Auditory Research, 4, 69-80.
- National Institutes of Health (1993). Early identification of hearing impairment in infants and young children. NIH Consensus Statement, 11(1), 1-24.
- National Center for Hearing Assessment and Management (2000). The status of newborn hearing screening in each state. April 2000, Utah State University,
https://www.infanthearing.org/status/unhsstate.html
- White, K. R., and Behrens, T. R. (1993). The Rhode Island Hearing Assessment Project: Implications for universal newborn hearing screening. Seminars in Hearing, 14(1). New York: Thieme Medical Publishers.
- Maxon, A. B., White K., and Behrens, T.R. (1995). Referral rates and cost efficiency in a universal newborn hearing screening program using transient otoacoustic emissions. Journal of the American Academy of Audiology, 6, 271-277.
- Mehl, A.L., and Thomson, V. (1998). Newborn hearing screening: The great omission. Pediatrics, 101(1), 4.
- Finitzo, T., Albright, K., and O'Neal, J. (1998). The newborn with hearing loss: Detection in the nursery. Pediatrics, 102(6), 1452 -1460.
- Mason, J.A. and Hermann, K.R. (1998). Universal infant hearing screening by automated auditory brainstem response measurement. Pediatrics, 101(2), 221-228.
- Vohr, B.R., Carty, L. M., Moore, P. E., and Letourneau, K. (1998). The Rhode Island Hearing Assessment Program: Experience with statewide hearing screening (1993-1996). Pediatrics, 133(3), 353-357.
- Prieve, B., Dalzell, L., Berg, A., Bradley, M., Cacace, A., Campbell, D., DeCristofaro, J., Gravel, J., Greenberg, E., Gross, S., Orlando, M., Pinheiro, J., Regan, J., Spivak, L., and Stevens, F., (2000). The New York State universal newborn hearing screening demonstration project: Outpatient outcome measures. Ear and Hearing, 21 (2), 104-117.
- Salata J.A., Jacobsen, J.T., and Strasnick, B. (1998). Distortion-product otoacoustic emissions hearing screening in high-risk newborns. Otolaryngology Head and Neck Surgery, 118(1), 37-43.
- Lutman, M.E., Davis A.C., Fortnum H.M. and Wood S. (1997). Field sensitivity of targeted neonatal hearing screening by transient- evoked otoacoustic emissions. Ear and Hearing, 18(4), 265-276.
- Mason S., Davis A.C., and Wood S. (1998). Field sensitivity of targeted neonatal hearing screening using the Nottingham ABR Screener. Ear and Hearing, 19(2), 91-102.
- Hahn, G. H. and Meeker, W. Q. (1991). Statistical Intervals, New York, Wiley-Interscience.
- Hahn, G. H. and Nelson, W. (1973). A survey of prediction intervals and their applications. Journal of Quality Technology, 5, 178-188
- For further information contact Dennis L. Burrows, Ph.D., Constance Brown Hearing and Speech Center, 1521 Gull Road, Kalamazoo, MI 49001 or E-mail at [email protected]
Portions of this paper were presented at the American Speech-Language-Hearing Association Annual Convention, San Francisco, 1999.
