
The vast majority of hearing aids dispensed in the United States now employ digital signal processing (HIA, 2007). The rapid transition from analog to digital processing is marked by the introduction of a host of new advanced digital features designed to enhance speech and reduce noise. Hearing aid manufacturers routinely conduct workshops, both online and in person, to teach dispensing professionals about their newest technologies and software updates. Even when professionals are presented with a sound rationale for a hearing aid design and explicit instructions for software implementation, there still remains a need to independently evaluate exactly how each feature works, as well as verify the performance of the hearing aids when worn by the patient. This has become increasingly difficult due to the complexity of today's hearing aid features and the interactions between them;however, test equipment and test signals are currently available to help accomplish the goals of both objective verification and digital feature evaluation.
The two tools best suited for objective verification and evaluation of hearing aid features are the 2cc coupler and probe microphone measurements. Test box measurements should be performed on all new and repaired hearing aids to ensure compliance with ANSI S3.22 1996 or 2003 specifications (Frye, 2005). Electroacoustic test results provide reliable data for quality control purposes;however, ANSI test results alone do not provide sufficient information about advanced digital features. Additional test box procedures are required for that purpose, and unlike with ANSI test procedures, digital features must be activated with the hearing aid set to user settings in order to conduct an accurate evaluation of real-world function.
Real-ear measures play a significant role in the routine verification of hearing aid performance (Mueller, 2001;Mueller et al., 1992,). Probe-tube recordings are most commonly used to verify that hearing aids are providing appropriate gain and output to match validated prescriptive gain and SPL targets such as NAL-NL1 and DSL [i/o]. However, modern test equipment also includes tools for more in-depth analysis of hearing aid features. Real-ear test equipment provides a means of testing all of the "multi" features in hearing aids: multi-channel compression, multi-channel noise reduction, multi-microphone directional patterns, and multi-memory. Even the decision rules implemented by the circuit algorithm designers can be deduced to some extent through judicious use of real ear test equipment protocols.
Decision rules are determined by the inherent capabilities of the signal processor or by the proprietary design goals of the manufacturer. Although some of the decision rules of a particular circuit may be conveyed to dispensing professionals by means of promotional literature or manufacturer workshops, many of the hearing aid operations are proprietary;therefore, this information is not readily accessible.
Fortunately, there are several different ways to learn about the decision rules. One method is to ask the manufacturer's spokesperson for an explanation of the hearing aid design philosophies and methods for implementing them (Chung, 2004). A second method is to test hearing aid features under controlled laboratory conditions and deduce the decision rules from the experimental results (Bentler & Chiou, 2006). This type of information has a great deal of clinical utility but new hearing aid models are introduced so frequently that it is impractical to test each new model in this way. A third method is to use the tools already available in most clinics to verify that the hearing aid features operate as specified and to evaluate specifically how each feature works. Many test signals have been developed for this purpose and are available with the current generation of test equipment (Cole, 2005;Frye, 2001;Kuk & Ludvigsen, 2003;Smirga, 2007).
There are a number of advanced hearing aid features that can be evaluated as long as routine test protocols are modified to do so. Chung (2004) compiled a list of high-technology features common to many manufacturers and outlined some of the differences between them. The following list is not exhaustive because hearing aid models and features are continuously changing:
- Multi-memory feature
- Noise reduction feature
- Multi-channel compression
- Temporal characteristics, including processing time and noise reduction onset time
- Occlusion management
- Digital feedback management
- Multi-channel processing
- Fixed or adaptive multi-microphone directionality
Current best practice protocols include conducting both coupler and real-ear measurements on all hearing aids using appropriate input signals. The Summary Guidelines for the Audiologic Management of Adult Hearing Impairment (Valente et al., 2006) state that special hearing aid features should be verified as well. To help facilitate compliance with these guidelines, Baum and Valente (2007) published a step-by-step manual illustrating exactly how dispensing professionals can use a Frye 7000 test system to verify many hearing aid functions. Audioscan recently introduced a test suite of procedures designed to streamline the verification process for critical hearing aid functions such as real-speech audibility, directional performance, effects of noise reduction, and benefits of the feedback reduction system (Audioscan, 2008). Similar information can be obtained using other equipment, although there will be slight differences in the procedures.
There are now a greater number of advanced features to verify than ever before. Paradoxically, there is also evidence that real-ear measures are not being used routinely in many clinics (Mueller, 2003). This is unfortunate because the real ear measurement process offers dispensing professionals the best opportunity to evaluate advanced hearing aid features. In addition, real-ear measures provide the best clinical means of capturing the effects of field-to-tympanic membrane transfer functions and accounting for the effects of multiple signal sources.
Testing non-linear, adaptive hearing aids can be challenging because the measured response varies greatly depending on the test signals selected. The availability of real speech and speech-like signals improves the reliability of the measurements of multi-channel digital devices (Warner Henning & Bentler, 2005). In addition, a spectrum analysis mode on the hearing aid analyzer allows the tester to use any type of input signal, such as music or white noise, to determine how the hearing aid circuit classifies and processes each one.
It has been shown experimentally that modern noise reduction algorithms generally identify speech correctly and pass those signals without attenuation;however, non-speech sounds such as white noise and music are attenuated to varying degrees depending on design philosophy. For example, some hearing aid algorithms attenuate music by as much as 20 dB, whereas others do not attenuate it at all (Bentler & Chiou, 2006). Music may be construed as noise under some conditions (overhead music in a restaurant) but as the primary signal of interest in other situations (musical performance at a local theater). It is easier to troubleshoot patient complaints such as poor sound quality when the decision rules are understood.
Perhaps the most compelling reason to routinely verify hearing aid and advanced feature performance is that doing so significantly improves the accuracy of the fitting. Software-based predictions of coupler and real ear responses are less accurate than actual coupler and real-ear measurements. The most obvious reason for this is because manufacturer software employs average, rather than individualized, real ear to coupler differences (RECDs). A second reason is that fitting philosophies vary among manufacturers. Some use published prescriptive procedures for "first fit" settings, while others use proprietary programming algorithms, thereby increasing the expected variability of the fitting results (Keidser et al., 2003). Surprisingly, manufacturers also use different correction factors or CORFIGs (Coupler Response for Flat Insertion Gain) in their software predictions (Hawkins & Cook, 2003). The CORFIG is the transformation that is added to a target insertion-gain response to arrive at the target coupler response.
Manufacturer programming software consistently overestimates real ear gain, especially in the high frequency region (Hawkins & Cook, 2003). Aarts and Caffee (2005) compared real ear results to manufacturers' software-predicted results for 79 ears and four hearing loss configurations. Their results were consistent with those of Hawkins and Cook (2003), demonstrating that the real-ear responses were significantly overestimated by software predictions, especially in the high frequency region. This was true for nearly all subjects and all configurations of hearing loss. The effect was greater for male than female subjects.
Aazh and Moore (2007) obtained real-ear insertion gain (REIG) measures on 42 ears that were fitted with digital hearing aids programmed by manufacturer software. They found that only 36% of the test ears showed REIG within 10 dB of NAL-NL1 targets from .25-.5 kHz. This was true for both occluding and non-occluding earmolds, a particularly relevant finding in view of the rapid increase in open canal (OC) fittings. After customized adjustments were made, 83% were within 10 dB of the prescriptive targets. The investigators concluded that REIG "can and should be used to achieve more accurate fittings" (Aazh and Moore, 2007).
OSPL90 settings also vary by manufacturer, even when patient-specific LDL data is entered into the fitting software (Mueller et al., 2008). Overall, the differences between software-predicted and measured real-ear responses are significant and may contribute to suboptimal user satisfaction.
The purpose of this paper is to present the results of a set of efficient test procedures designed to evaluate performance of digital hearing aid features using readily available test equipment. Best practice requires that verification procedures be completed on every new and repaired hearing aid (Valente et al., 2006). Some of the procedures presented here are an integral part of the verification process, while others are meant to complement the standard verification procedures. The latter should be performed primarily on unfamiliar models so that the dispensing professional might gain a greater understanding of the performance characteristics unique to that signal processor.
Modern hearing aid test equipment is very versatile. Several manufacturers have introduced models that allow for multi-curve analysis using a variety of pure tone and broadband signals, including real speech. The availability of multiple types of input signals is essential to the accurate measurement of digital instruments. The data in this paper was acquired using a Frye 7000 hearing aid analyzer;however, the same type of information can be obtained on equipment from other manufacturers.
Most of the measurements in this paper were obtained from a single digital hearing aid programmed for a flat 50 dB sensorineural hearing loss. The test hearing aid had 20 signal processing channels and 20 adjustable frequency bands. It included many advanced features such as wind noise reduction, adaptive directionality, adjustable digital noise reduction, digital occlusion manager, automatic and manual multi-memory selection, and digital feedback reduction utilizing phase inversion. Other hearing aid designs were used where specified in order to better highlight specific performance characteristics.
Basic Multi-Memory Measurement Using the Multi-Curve Function
Most digital hearing aids include a multi-memory feature for different listening situations. This feature may be activated automatically or by manual switching, depending on the hearing aid design and programming. It is useful to measure the basic gain/frequency response of the aid for each of the available memories when the aid is programmed to the user settings. This simple test allows the professional to address concerns about performance that are specific to individual hearing aid memories, such as feedback in the acoustic telephone setting or excessive gain in the noise reduction setting. Also, the volume range available to the user is easily documented with this technique.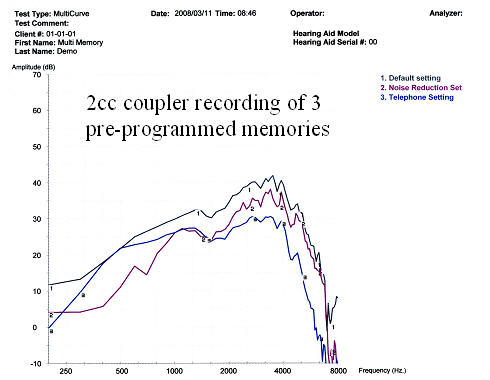
Figure 1. Multi-curve comparing quiet, noise reduction, and telephone memories.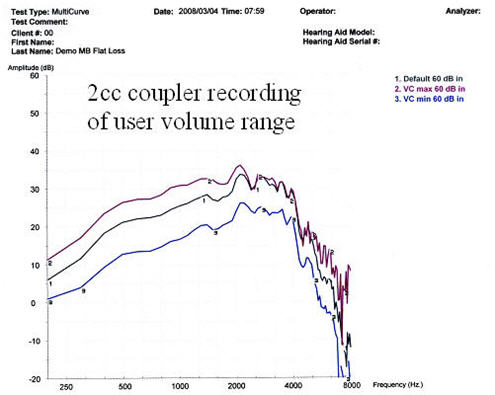
Figure 2. Multi-curve showing user's available volume range.
Figures 1 and 2 show an example of a multi-curve analysis used to analyze memory function and volume control, respectively. In the example illustrated in Figure 1, the default quiet memory has higher gain than the noise and acoustic telephone memories, at least for a speech-like input. Figure 2 shows that in the main memory setting, although the manual volume control allows for a user-selected 6 dB decrease in volume (VC min), no increase in volume is actually possible for high frequencies (VC max), despite what is indicated by the fitting software.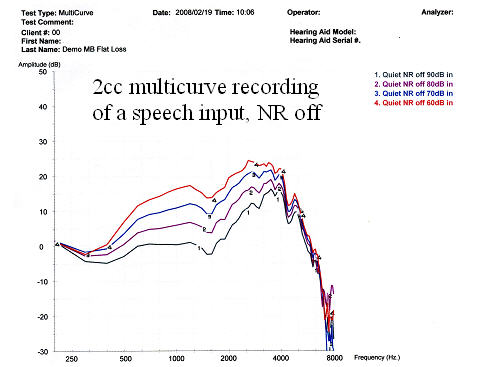
Figure 3. Multi-curve demonstrating compression of a Digispeech signal with noise reduction (NR) off.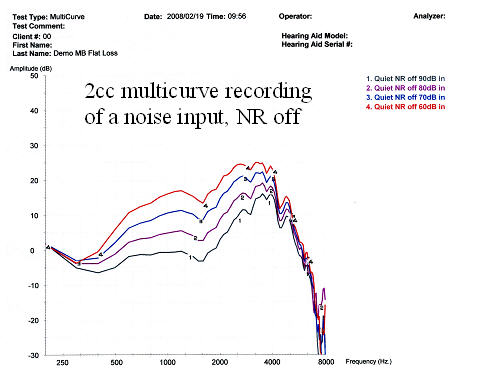
Figure 4. Multi-curve demonstrating compression of a composite speech-weighted signal with NR off.
Figures 3 and 4 are input/output functions for broadband stimuli. These results are comparable to the ANSI S3.22 1992 data for this model hearing aid. The DigSpeech stimulus shown in Figure 3 has speech-like modulations, whereas the composite signal shown in Figure 4 is speech-weighted but lacks the modulations typical of real speech. The wide dynamic range compression (WDRC) is nearly identical for both types of signals. Because the noise reduction was deactivated, these results reflect the compression characteristics of the instrument rather than the noise reduction.
Multi-curve Real-Ear Procedures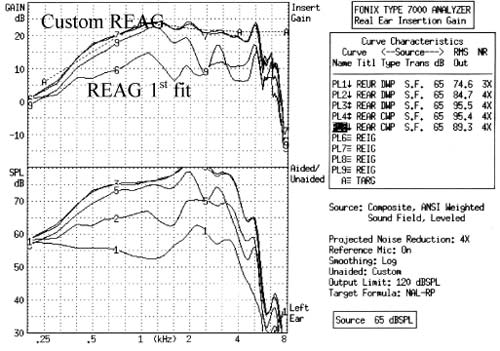
Figure 5. Multi-curve real-ear response curves. The upper graph shows the real-ear results expressed in dB gain. The lower graph shows the same data expressed in dB SPL. Curve 1 - Real ear unaided response (REUR);Curves 2 & 6 -Real ear aided gain (REAG) at first fit setting;Curves 3, 4, 7 & 8 - REAG at custom settings;Curves 5 & 9 - REAG for a 180-degree azimuth input.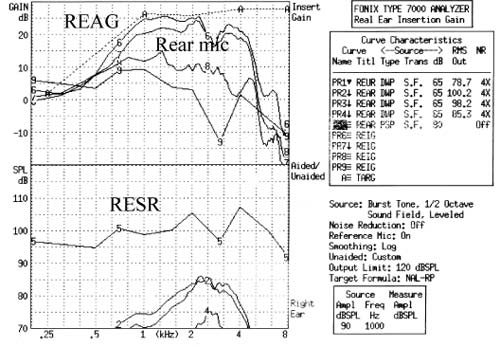
Figure 6. Multi-curve real-ear response curves. The upper graph shows the real-ear results expressed in dB gain. The lower graph shows the same data expressed in dB SPL. Curve 1 - REUR;Curves 2 & 6 - User default "quiet" settings;Curves 3 & 7 - User default "noise reduction" settings for an input at 0-degrees azimuth;Curves 4 & 8 - User default "noise reduction" settings for an input at 180-degrees azimuth;Curves 5 & 9 - Real ear saturation response (RESR) for user default "quiet" setting.
Figures 5 and 6 display real-ear gain and SPL results. Figure 5 illustrates the difference between the software-calculated first fit and the settings after programming adjustments. The first fit prescribed gain was 10-15 dB below target for a monaural fitting for the hearing loss entered. Both figures 5 and 6 illustrate front-back ratios for broadband signals, verifying that the directional function is active in this configuration.
Noise Reduction Settings
Whenever possible, noise reduction should be measured with minimal contribution from directional microphones and compression. In order to accomplish this, the directional microphones should be deactivated and the aids should be set to their most linear mode. When the variable of interest is noise reduction, the input signal must be presented for a duration that is long enough to activate it. Typically, between five and thirty seconds of continuous signal is required in order to document the full effect of the noise reduction.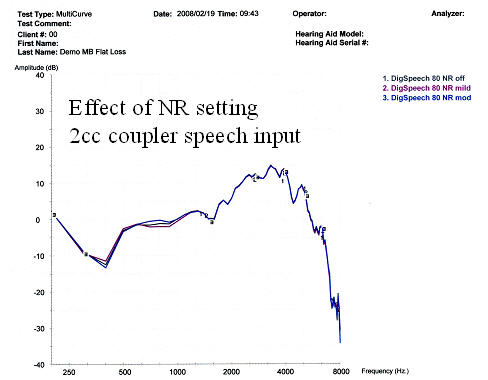
Figure 7. Comparison of NR settings using an 80 dB SPL DigSpeech input with NR off, mild NR, and moderate NR.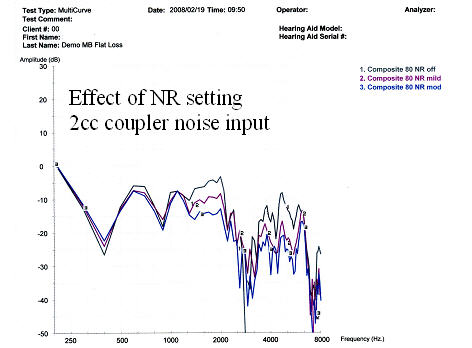
Figure 8. Comparison of NR settings using an 80 dB SPL composite input with NR off, mild NR, and moderate NR.
Figure 7 shows that the noise reduction setting does not affect the gain of a speech-like signal, regardless of the noise reduction level selected. Conversely, the non-speech signal shown in Figure 8 is dramatically attenuated at all of the noise reduction settings and receives the greatest attenuation at higher noise reduction settings.
Temporal Characteristics
There are at least three temporal characteristics of interest: compression attack and release times, group delay, and onset time. Compression attack and release times can be measured using standard ANSI S3.22 1996 or 2003 protocols. Group delay refers to the processing time of the circuit (Frye, 2001). All digital hearing aids need time to process signals. If possible, the user's own voice and outside signals arriving through the direct pathway (vent) should arrive at the same time as the amplified signal. As group delay is increased, perceived sound quality can decrease for both normal hearing individuals (Agnew, 2000) and hearing impaired subjects (Stone & Moore, 2005). Ideally, the group delay and phase should be equal for both left and right hearing aids (Frye, 2001). Group delay tests are not currently included in the ANSI standard. Typical results are shown in Figure 9 below.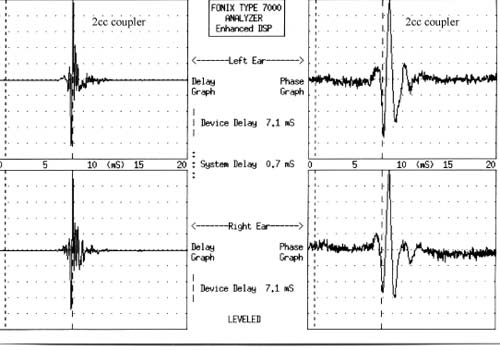
Figure 9. The upper left graph shows the group delay for the left hearing aid. The upper right graph shows the phase for the left hearing aid. The lower left and right graphs provide the same data for the right hearing aid.
The third temporal characteristic of interest is onset time. Onset time is defined as the time it takes for the algorithm to complete the noise reduction process after a noise has been detected by the speech/non-speech detector (Bentler & Chiou, 2006). Several seconds may elapse between the onset of noise reduction and the completion of the process (Chung, 2004).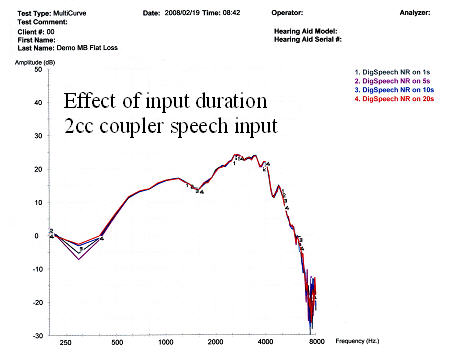
Figure 10. The effect of input duration on noise reduction using a 65 dB SPL DigSpeech input for 1, 5, 10, & 20 seconds.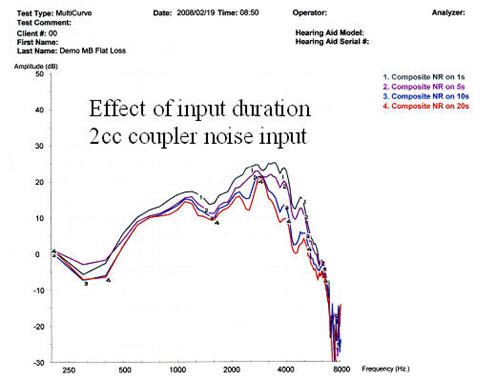
Figure 11. The effect of input duration on noise reduction using a 65 dB SPL composite input for 1, 5, 10, & 20 seconds.
Figure 10 illustrates that DigSpeech is classified as "speech" by the algorithm of the hearing aid used in this study and is not attenuated by the noise reduction feature, regardless of duration. In Figure 11, the composite signal is classified as noise and is attenuated by 5-15 dB. It takes at least 20 seconds for the noise reduction to fully attenuate the noise signal.
Number of Processing Channels
When a speech-like signal is used to test a hearing aid, a bias tone can be introduced to activate the noise reduction in the processing channel corresponding to the frequency of the bias tone. This test can be used to verify the activation of noise reduction features and to determine the bandwidth of the attenuated frequency region. Hearing aids with fewer processing channels attenuate signals in broader frequency regions, even when the noise stimulus has a narrow bandwidth.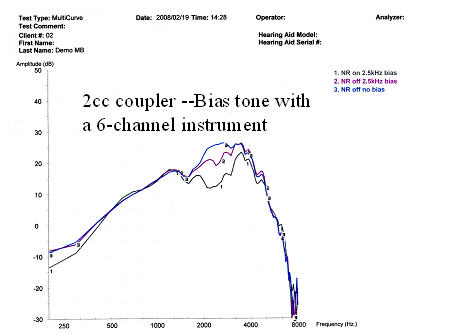
Figure 12. The effects of a 2500 Hz bias tone on a hearing aid with six processing channels and two levels of NR.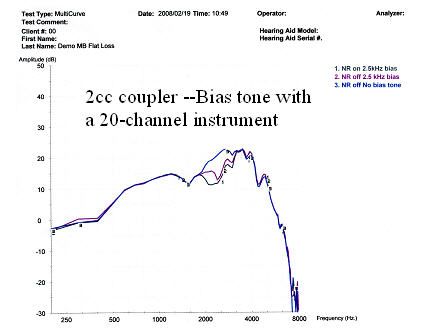
Figure 13. The effects of a 2500 Hz bias tone on a hearing aid with 20 processing channels and two levels of NR.
Figures 12 and 13 illustrate how a bias tone activates noise reduction in a region surrounding the frequency of the bias tone. The attenuated bandwidth is wider for the 6-channel instrument (Figure 12) than it is for the 20-channel instrument (Figure 13). Consequently, a greater percentage of the speech-like signal is attenuated along with the noise in the 6-channel design. Increasing the number of processing channels can potentially increase speech audibility in some frequency regions and can improve noise suppression and feedback strategies;however, it may also increase the risk of temporal smearing and group delay (Mispagel & Valente, 2006).
Detection Rules for Speech/Noise/Music
Modern hearing aids use speech/non-speech detectors that identify characteristics of speech and noise. Ideally, the noise reduction algorithm will improve the signal-to-noise ratio by correctly classifying noise signals as noise and by selectively attenuating them. Published data demonstrate how decision rules are implemented in a sampling of commercially available devices (Bentler & Chiou, 2006). Clinically, similar information can be measured using a combination of speech and non-speech stimuli. As shown in Figures 14-19, each type of signal provides somewhat different information about the decision rules.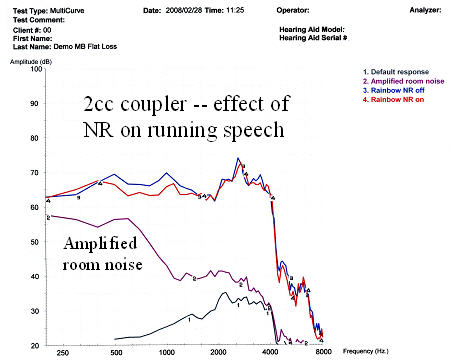
Figure 14. The effect of NR on running speech using the rainbow passage with NR on (red) and NR off (blue). The hearing aid gain/frequency response (Curve 1) is shown for a reference.
Figure 14 illustrates the effect of noise reduction on a running speech sample. There is a very mild attenuation for low frequency sounds when the noise reduction is active. It is important to note that this test was performed in an ambient environment, not a sound booth. The room noise (Curve 2 - purple) measured through the hearing aid may influence the noise reduction effect. This is a problem for measurements taken outside of an anechoic chamber, especially for low intensity inputs.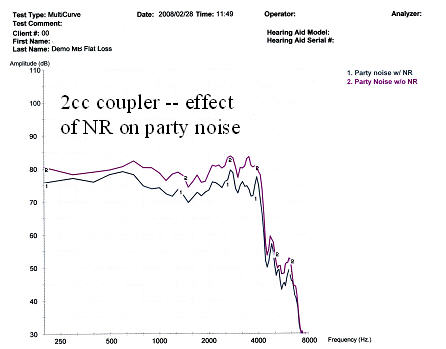
Figure 15. The effect of NR on party noise with NR off (purple) and NR on (gray).
Figure 15 displays the effect of the noise reduction feature on party noise. For this hearing aid, a broadband gain reduction is seen when the noise reduction is activated.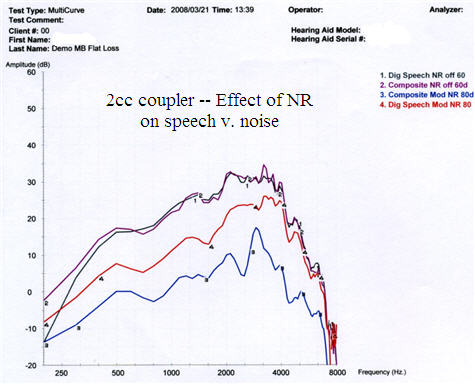
Figure 16. The effect of NR on speech versus noise with noise reduction on and off in the quiet memory and the speech-in-noise memory with DigSpeech (red) and composite speech-weighted noise (blue) inputs.
For the hearing aid tested, Figure 16 illustrates that the gain is equal for 60 dB SPL DigSpeech and composite noise inputs with the noise reduction deactivated. When noise reduction is activated, gain is reduced more for an 80 dB SPL composite noise signal compared to the DigSpeech input. Both types of inputs are attenuated relative to their baseline readings because the algorithm automatically switched to the speech-in-noise memory, designed to increase comfort and decrease noise.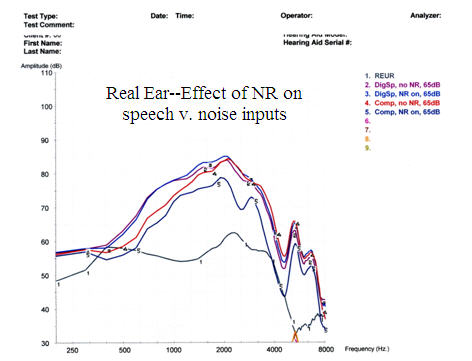
Figure 17. Real-ear measures showing the effect of NR on speech and noise: Curve 1 - REUR;Curve 2 - REAG for DigSpeech without NR;Curve 3 - REAG for DigSpeech with NR activated;Curve 4 - REAG for composite speech-weighted noise without NR;Curve 5 - REAG for composite speech-weighted noise with NR activated.
Figure 17 illustrates that activation of the noise reduction feature in the quiet program has no effect on the gain of DigSpeech;however, activation of the noise reduction feature does have a significant effect on the gain of composite speech-weighted noise signals.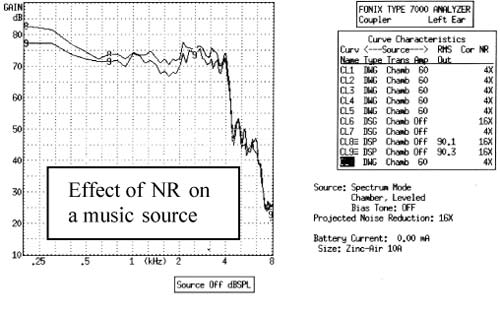
Figure 18. Effect of NR on a 30-second music passage;without NR (top curve) and with NR (bottom curve).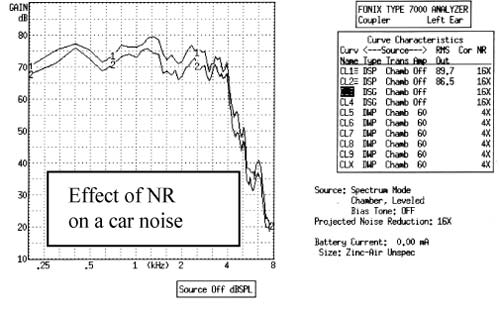
Figure 19. Effect of NR on a car noise sound file, without NR (top curve) and with NR (bottom curve).
Figure 18 illustrates the attenuation of a 30-second music passage by 0-5 dB by the noise reduction feature in the hearing aid used in this test. Figure 19 illustrates that activation of the noise reduction feature attenuates a 30-second sound file of car noise by 0-5 dB. Both were measured at a 0-degree azimuth in the omnidirectional mode.
Occlusion Effect
Most manufacturers' hearing aid software includes a feature designed to compensate for the occlusion effect. There are multiple ways to verify the performance of this feature. First, the examiner can screen for occlusion problems by listening to the patient's voice through headphones attached to the output port of the probe-tube system with the hearing aid in place. The second option is to measure the real-ear occlusion response before and after the occlusion manager is activated. It is also possible to test the hearing aid electroacoustically at multiple input levels with the occlusion manager on and off to view the effects of the occlusion manager and input on the hearing aid response curve.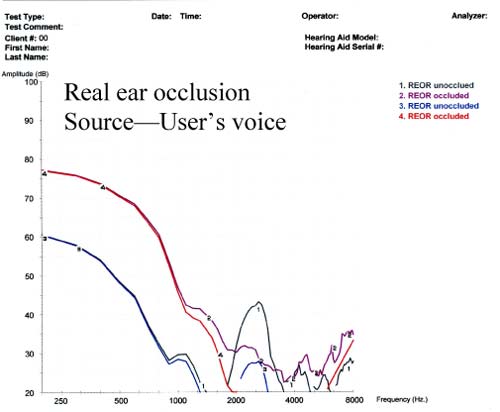
Figure 20. Assessment of real-ear occlusion response (REOR) by measuring the user's own voice with the earmold in place (red) and without the earmold in place (blue).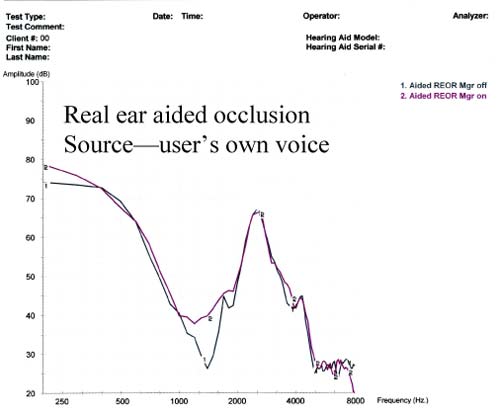
Figure 21. Amplified real-ear occlusion (ampclusion) without occlusion manager (gray) and with occlusion manager (purple).
Figure 20 demonstrates the degree of occlusion caused by the insertion of a custom earmold. This was measured using the method recommended by Mueller et al. (1992). The effect is greatest below 1 kHz. Figure 21 shows a real-ear analysis of aided ampclusion. This is the combined effect of the amplification of the user's own voice by bone conduction (occlusion) and air conduction (amplification through the hearing aid) (Kuk & Ludvigsen, 2002). There is little measurable difference between the measurements before and after the occlusion manager has been activated.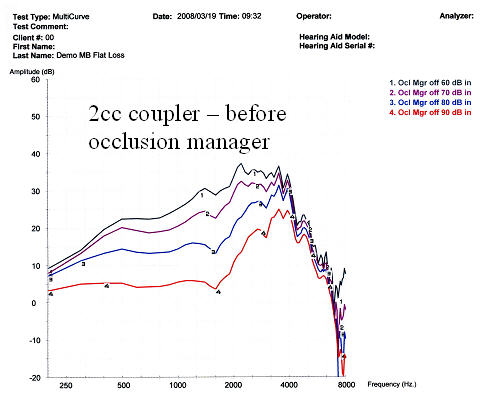
Figure 22. Multiple input levels of DigSpeech before occlusion manager activation.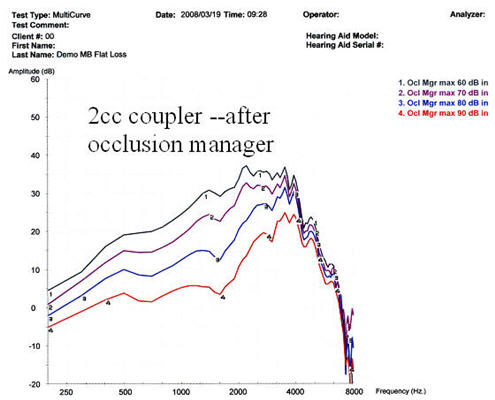
Figure 23. Multiple input levels of Digspeech after occlusion manager activation.
Figures 22 and 23 are coupler measurements of the same hearing aid with and without the occlusion manager activated. There is a small but measurable attenuation of low frequencies along with a change in the compression ratio when the occlusion manager is activated.
Digital Feedback Management
The presence of feedback can be identified by listening to the patient's hearing aids through headphones attached to the output of the probe microphone system. Alternately, feedback may be identified as a peak or series of peaks in the real ear or coupler response curves. Digital feedback software is used to identify feedback and to correct for it electronically. Early digital feedback managers limited feedback by reducing gain or creating a notch filter at the feedback frequency (Chung, 2004). More recently, phase inversion has been used in an attempt to limit feedback without gain reduction. Both real ear and coupler measurements can demonstrate the effect of the digital feedback management on the available gain of the aid. In order to calculate available user gain, the REAG is measured before and after the feedback manager is activated. Results are then confirmed on a 2cc coupler.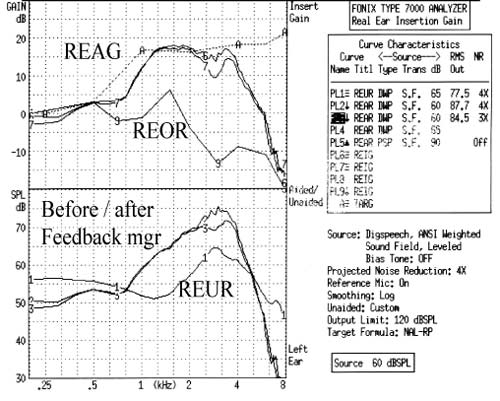
Figure 24. REAG before and after feedback manager. The upper graph shows real ear results expressed in dB gain. The lower graph shows the same data expressed in dB SPL. Curve 1 - REUR;Curves 2 & 6 - REAG before feedback manager;Curves 3 & 7 - REAG after feedback manager.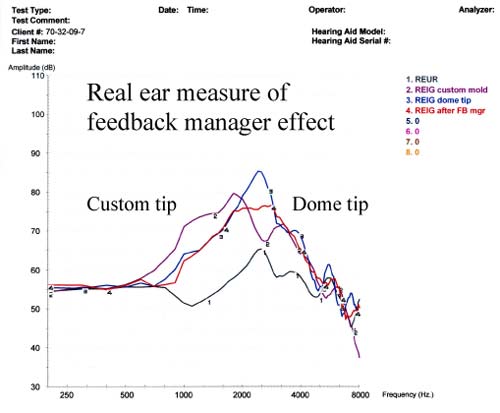
Figure 25. Real-ear measure of the effect of feedback manager on an open canal fitting: REUR (gray);REAG with dome tip before feedback manager (blue);REAG after feedback manager (red);REAG with a custom tip instead of a standard dome (purple).
Figure 24 shows the effect of the digital feedback manager on REAG. User gain was reduced by 5 dB at 3 kHz following activation of the feedback manager. Figure 25 illustrates the same effect in an open canal (OC) fitting. User gain is reduced by 10 dB at 2.7 kHz with the feedback manager activated. This system uses phase inversion, not gain reduction, but the gain is, in fact, reduced. Figure 25 also illustrates the difference between a dome tip and a custom open earmold mounted on a slim tube. More gain is obtained with the custom earmold between 1-2 kHz, but insertion loss is greater between 3-4 kHz.
Multi-Microphone Directional Effects
Multiple microphones are used to provide maximum amplification for on-axis signals. This is based on the assumption that target speech will arrive from zero or near zero degrees azimuth. The gain of off-axis signals is selectively reduced because it is more likely to contain interfering noise signals. The null point on the polar plot is determined by the internal delay between the two microphones. The directionality can be fixed, adjustable, or adaptive. Although published polar plots cannot be readily reproduced in clinical settings, front-back ratios (FBRs) can be used clinically to verify the function of the microphones and to determine how the noise reduction feature interacts with the directional microphone feature.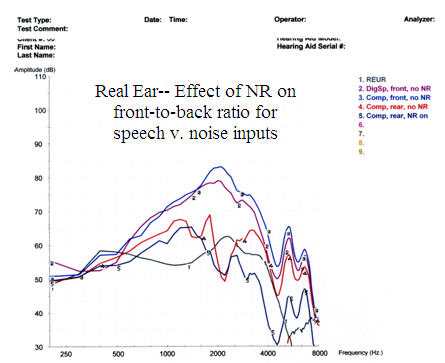
Figure 26. Assessment of the front-back ratio with and without NR comparing DigSpeech to a composite speech-weighted noise input: REUR (gray);front microphone without NR (DigSpeech - purple, composite speech-weighted noise - blue);rear microphone composite speech-weighted noise without NR (red);rear microphone composite speech-weighted noise with NR (Curve 5 - dark blue).
Figure 26 illustrates a front-back ratio measured in a test box both with and without noise reduction. Gain for signals at 180-degrees azimuth is reduced in the directional mode and is further reduced by activation of the noise reduction, even when the signal is classified as speech by the hearing aid algorithm.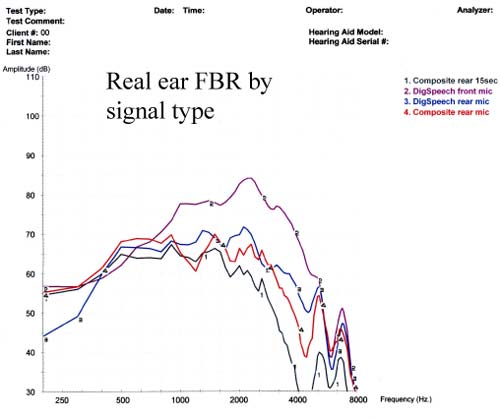
Figure 27. Assessment of the front-back ratio with NR on as a function of input signal type: front microphone DigSpeech signal (purple);front microphone composite signal (red);rear microphone DigSpeech signal (blue);rear microphone composite signal (gray).
Figure 27 illustrates that the front-back ratio varies with the signal type. For the DigSpeech input, gain reduction is evident for the 180-degree azimuth but not the 0- degree azimuth. Conversely, for the composite noise input, gain reduction is evident for both 0 and 180-degree azimuths. This is a result of the differential effect of the noise reduction on speech versus noise signals.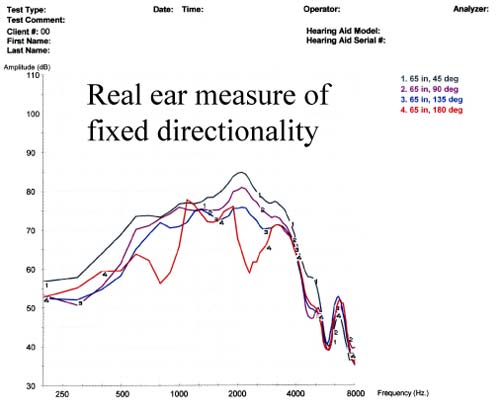
Figure 28. Real-ear assessment of fixed directionality at multiple azimuths with DigSpeech input and NR off.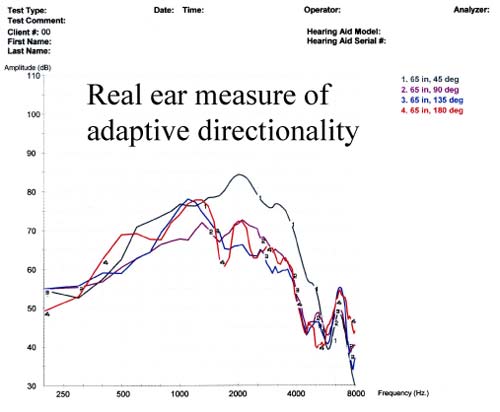
Figure 29. Real-ear assessment of adaptive directionality at multiple azimuths with DigSpeech input and NR off.
Figures 28 and 29 illustrate the effects of the adaptive directional feature. Source signals at 90 and 135-degrees azimuth are attenuated more in the adaptive directional mode than in the fixed directional mode. This verifies that the polar null shifts with the noise source for this hearing aid, at least when there is only one noise source. These results may not generalize to diffuse noise conditions (Bentler et al., 2004).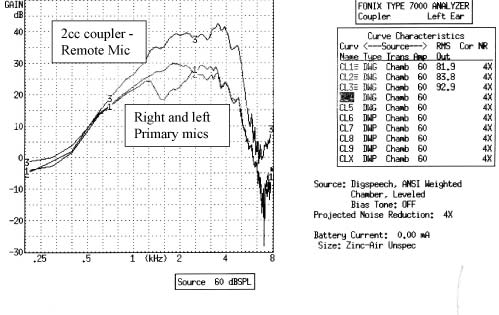
Figure 30. Coupler analysis of FM microphone input: Curve 1- right hearing aid default coupler gain;Curve 2 - left hearing aid default coupler gain;Curve 3 - right hearing aid with remote FM microphone input.
Figure 30 illustrates how a remote microphone can be measured with the multi-curve feature and compared to the standard microphone inputs. The remote microphone was placed in the calibrated position in the center of the test box in order to obtain this measure.
Summary of Test Findings
Based on the results of the outlined test conditions presented in this paper, the following conclusions can be reached about the instruments used in this study:
- Gain is greatest in the quiet setting. Low frequencies are attenuated in the noise reduction memory and high frequencies are attenuated in the acoustic telephone memory.
- The fitting software indicated a user volume range of +6/-10 dB;however, at the test settings there is no actual user gain increase available above 2 kHz.
- In the default WDRC processing scheme, input/output functions are identical for speech (DigSpeech) and noise (composite speech-weighted noise) inputs when noise reduction is deactivated.
- With noise reduction activated, the DigSpeech input is classified as real speech and is not attenuated unless it arrives from an off-axis source in the directional mode.
- The composite signal is classified by this algorithm as noise and is attenuated anytime the noise reduction is active.
- Car noise, party noise, and music are all classified as noise when the noise reduction is activated, regardless of azimuth.
- Increasing the noise reduction setting increases the attenuation of signals classified as noise.
- The noise reduction takes at least 20 seconds to achieve maximal attenuation.
- The noise reduction in the 20-channel test instrument attenuates a narrower band of energy around the bias frequency than it does in a 6-channel design on the same digital platform.
- The real-ear occlusion effect was easily measured, but the effect of the occlusion manager was more difficult to objectively verify.
- Both real-ear and coupler measurements verified that the phase inversion feedback manager did reduce gain within the speech range.
- The group delay for this instrument is acceptably short. Phase was identical for the two test instruments.
- Real-ear measurements indicate that the manufacturer's first fit prescribed gain well below the actual NAL-RP target gain, necessitating a gain increase of 10-15 dB.
- The front-back ratio (FBR) verified that signals from 90-180 degrees azimuth were attenuated relative to the 0 degree input.
- The FBR results showed that the amount of attenuation for off-axis signals increased as the noise reduction setting increased.
- Activation of the adaptive directional feature resulted in greater attenuation of signals at the 90 and 135-degree azimuths compared to the fixed directional settings.
Limitations and Future Directions
The data presented here primarily reflect the performance of the hearing aids selected for this study programmed for one hearing loss configuration. The same hearing aid programmed for different hearing configurations might yield significantly different results. Likewise, hearing instruments from other product lines are likely to yield a variety of response variations as well. Input-related response variability should not be viewed as a deterrent but rather as further evidence of the need to objectively verify all of the unique parameters of each new model.
Hearing aid designs in the future will be even more complex and technically challenging than today's models. Future developments are likely to include digital wireless technology, increased use of Bluetooth connectivity, ear-to-ear connectivity for enhanced binaural processing and directional beam-forming, improved signal processing algorithms, and increased use of intelligent technology and auditory scene analysis strategies (Edwards, 2007). Verification of remote source inputs (Figure 30) and adaptive directionality (Figure 29) can be performed using existing real-ear technology. Verification of models employing intelligent designs and auditory scene analysis strategies will be more challenging because the results will be valid only for a single specified test condition. Manufacturers could facilitate this process by continuing to provide test measurement settings for each of the main environmental conditions, such as speech in noise, music listening, acoustic telephone, and others. This practice will allow dispensing professionals to verify the performance changes that take place in each environmental condition by isolating the set of parameters specific to that condition.
Conclusions
The first step in the clinical verification process is a commitment from the fitting professional to verify the performance of every hearing aid every time. Doing so creates an opportunity to identify operating characteristics that are unique to each hearing aid model. Objective tests can and should be performed on digital hearing aid designs for routine verification and evaluation of advanced digital features. Judicious choices of test materials enable the professionals to understand many of the decision rules incorporated in digital algorithms. This, in turn, allows the professional to make informed recommendations about available designs, justify cost differences between models, and more effectively troubleshoot patient complaints of unsatisfactory hearing aid performance. Given the rapid rate of new technology introductions, evidence-based data is not always available for evaluating performance claims for each technology. Comprehensive 2cc coupler and real-ear test measurements currently offer the most efficient means of obtaining objective information needed for the verification of hearing aid performance and the evaluation of special hearing aid features.
References
Aarts, N.L. & Caffee, C.S. (2005). Manufacturer predicted and measured REAR values in adult hearing aid fitting: Accuracy and clinical usefulness. Int J Audiol, 44, 239- 301.
Aazh, H. & Moore, C.J.B. (2007). A value of routine real-ear measurement of the gain of digital hearing aids. J Am Acad Audiol, 18, 653-664.
Agnew, J. & Thornton, J.M. (2000). Just noticeable and objectionable group delays in digital hearing aids. J Am Acad Audiol, 11, 330-336.
Audioscan Press Release (2008). www.audioscan.com/resources/pressreleases/Revolutionarytestsuite.pdf.
Baum, E. & Valente, M. Using the Fonix 7000 to verify coupler and real-ear performance to adhere to the AAA guidelines for the audiologic management of adult hearing impairment. Retrieved April 12, 2007 from frye.com/manuals/Valente_FryeGuidebook.pdf.
Bentler, R. & Chiou, L.K. (2006). Digital noise reduction: An overview. Trends Amplif,10 (2), 67-82.
Bentler, R., Tubbs, J., Egge, J., Flamme, G., & Dittberner, A. (2004). Evaluation of an adaptive directional system in a DSP hearing aid. Am J Audiol, 13, 73-79.
Chung, K. (2004). Challenges and recent developments in hearing aids, Part 1. Speech understanding in noise, microphone technologies and noise reduction algorithms. Trends Amplif, 8 (83), 83-124.
Cole, B. (2005). Verifit test signals. Retrieved April 12, 2008 from www.audioscan.com/resources/audionotes/AN-02 VerifitTestSignals.pdf.
Edwards, B. (2007). The future of hearing aid technology. Trends Amplif, 11, 31-45.
Frye, G. (2001). Testing digital hearing and analog hearing instruments: processing time delays and phase measurements. Hear Rev, 8 (10), 34-40.
Frye G. (2005). Understanding the ANSI standard as a tool for assessing hearing instrument functionality. Hear Rev, May.
Hawkins, D.B., & Cook, J.A. (2003). Hearing aid software predictive gain values: How accurate are they? Hear J, 56(26), 28, 32, 34.
HIA The Insider: Hearing aid sales rise by 3.5% in the first half of 2007. Retrieved April 12, 2008 from www.hr-hpr.com/insider/2007-07-26_01.asp.
Keidser, G., Brew, C., & Peck, A. (2003). Proprietary fitting algorithms compared with one another and with generic formulas. Hear J, 56(3), 28, 34-38.
Kuk, F. & Ludvigsen, C. (2002). Ampclusion management 101: Understanding variables. Hearing Review, 9(8).
Kuk, F. & Ludvigsen, C. (2003). Changing with the times: Choice of stimuli for hearing aid verification. Hearing Review, 10(8), 22-28.
Mueller G. (2001). Probe Microphone Measurements: 20 Years of Progress. Trends Amplif 5:35-68.
Mueller G (2001). Probe-mic assessment of digital hearing aids? Yes, you can! Hear J, 54:1, 10, 12, 14, 17.
Mueller, G. (2003). Fitting test protocols are "more honored in the breach than the observance." Hear J, 56(19), 20, 22-24, 26.
Mueller, G., Bentler, R., & Wu, Y. (2008). Prescribing maximum hearing aid output: Differences among manufacturers found. Hear J, 61(3), 30-36.
Mueller, G., Hawkins, D., & Northern, J. (1992). Probe Tube Measurements: Hearing Aid Selection and Assessment. San Diego, CA: Singular Publishing Group.
Smriga, D. (2007). Objective clinical verification of digital hearing instruments. Retrieved April 12, 2008 from www.audioscan.com/resources.
Stone, M.A. & Moore, Brian C.J. (2005). Tolerable hearing-aid delays: IV. Effects on subjective disturbance during speech production by hearing-impaired subjects. Ear Hear, 26, 225-235.
Valente, M., Abrams, H., Benson, D., Chisolm, T., Citron, D., et al. (2006). Summary guidelines for the audiologic management of adult hearing impairment. Audiology Today, 18:5.
Valente, M., Mispagel, K.M., Tchorz, J. & Fabry, D. (2006). Effect of type of noise and loudspeaker array on the performance of omnidirectional and directional microphones. J Am Acad Audiol, 17, 398-412.
Warner Henning, R. frye.com/manuals/Valente_FryeGuidebook.pdf & Bentler, R. (2005). Compression-dependent differences in hearing aid gain between speech and nonspeech signals. Ear Hear, 26, 409-
422.